Featured Examples (Simulation)
(Requires NetSim Std/Pro Ver: v15.0 or higher, with Emulator Add-on)
All examples discussed in the manual will have a fixed setup in NetSim.
IEEE C37.118 Synchrophasor Protocol
This featured example demonstrates a Distributed Multi-Host Co-Simulation designed to validate the impact of cyber-attacks on IEEE C37.118 Synchrophasor data streams.
Protocol Overview
The IEEE C37.118 standard is the dominant protocol for Synchrophasor data transmission in Wide Area Monitoring Systems (WAMS). It defines four distinct message types:
Data: Measurements made by the PMU (Phasors, Frequency, Analog).
Configuration: Machine-readable message describing the data format and calibration factors.
Header: Human-readable descriptive information provided by the user.
Command: Machine-readable codes sent to the PMU for control (e.g., Start/Stop transmission).
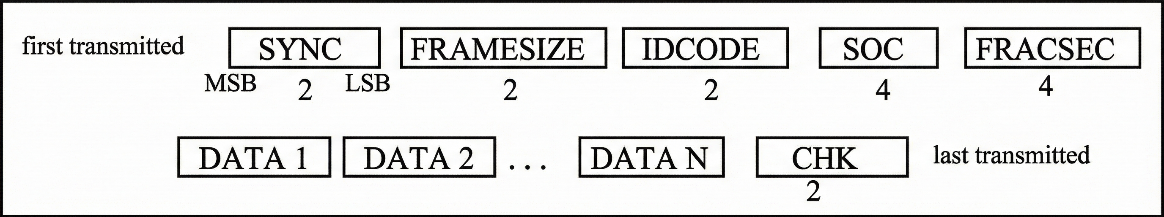
Frame Structure regardless of the message type, all transmissions follow a common binary frame structure as defined in the standard. This structure ensures that information—whether it is real-time data or configuration files—can be consistently parsed by the Phasor Data Concentrator (PDC).
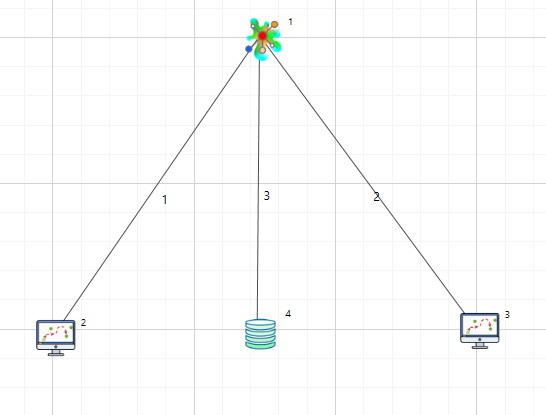
NetSim Cyber Architecture (3-System Setup)
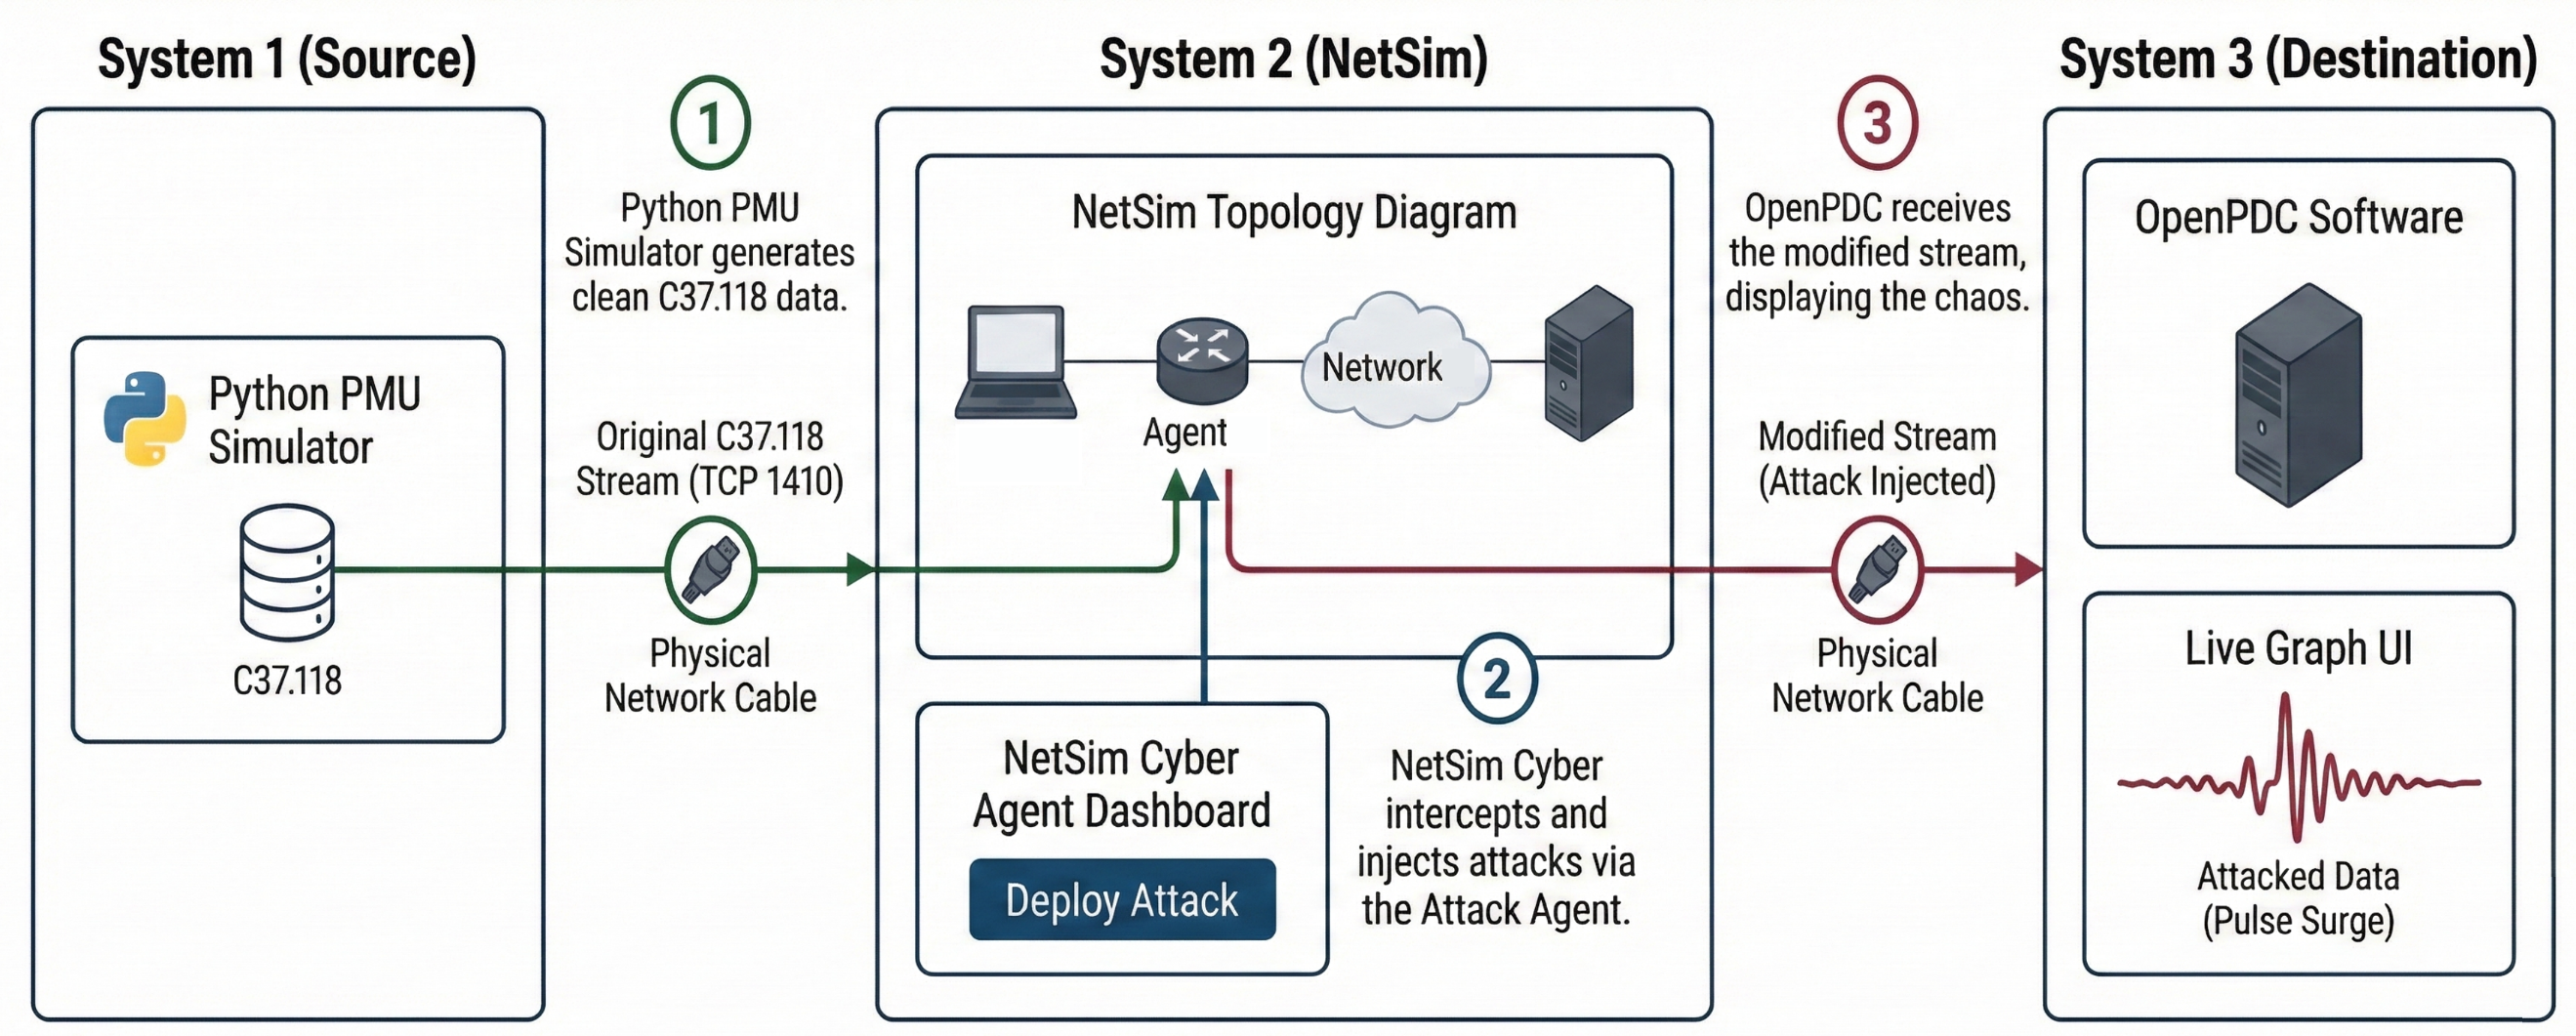
This experimental setup is configured as a Distributed Multi-Host Co-Simulation. The architecture involves three distinct physical systems interconnected via a Local Area Network (LAN). NetSim Cyber functions as a real-time network platform (Man-in-the-Middle) to intercept, buffer, manipulate, and forward traffic between the Generation Tool and the Monitoring Tool.
The Physical Topology:
System 1 (Source): Runs the Python PMU Simulator.
System 2 (NetSim Cyber): Runs NetSim with the Cyber module.
System 3 (Destination): Runs OpenPDC.
Component Description
System 1: Real Source (PMU)
Software: Python PMU Simulator (Generation Tool)
Tool Description: A custom Python-based PMU simulator implementing IEEE C37.118 uses the synchrophasor library to stream data. It waits for a connection request from the PDC and, once the handshake is complete, continuously streams synchrophasor data samples.
Configuration: Generates IEEE C37.118-compliant synchrophasor data over its physical Network Interface Card (NIC).
Example IP: 192.168.0.83
System 2: NetSim Cyber Network
Role: Network Simulation and Attack Injection
Real Node Mapping: The “Real Node” devices in the NetSim topology are mapped to the physical network interfaces of System 2. NetSim Cyber bridges live traffic between the PMU (System 1) and the PDC (System 3).
Attack Agent: The Agent node inside virtual network is positioned logically between the source and destination nodes to intercept real-world synchrophasor traffic and perform payload modification or timing manipulation attacks.
Example IP: 192.168.0.81
System 3: Real Destination (PDC)
Role: Phasor Data Concentrator (PDC)
Software: OpenPDC
Tool Description: OpenPDC functions as the data destination and master station in the IEEE C37.118 communication architecture. It acts as the initiator, establishing a connections to the PMU, collecting synchrophasor measurements, and performing data visualization, time alignment, and archival.
Configuration: Connects to configured PMU sources to receive, visualize, and store IEEE C37.118 data streams.
Example IP: 192.168.0.82
Implemented Attack Vectors
The following seven attack modules were available for selection each targeting specific fields of the IEEE C37.118 data frame:
Data Decrement / Increment Attack
Random Noise Injection
Pulse Surge Attack
Ramp Attack
Frequency/ROCOF Attack
Time Synchronization Attack
Experimental Procedure
To validate the impact of cyber-attacks in a real-network environment, the following procedure is executed:
Step 1: Network Connectivity & Initialization
Ensure all three systems are interconnected via the Local Area Network (LAN).
Verify connectivity using ping commands between System 1, System 2, and System 3.
Step 2: Launch NetSim UI (System 2)
Start NetSim: Launch the NetSim Cyber Suite tile on System 2 (Gateway).
Wait: Ensure the UI is running. It will begin broadcasting on port 19001 to find clients.
Step 3: Connect Clients (Systems 1 & 3)
Execute NetSimCyberClient.exe as Administrator on both System 1 (Source) and System 3 (Destination).
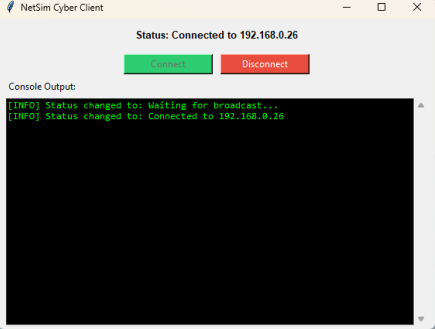
Check that the status on both clients changes to “Connected to [NetSim IP]”
Result: The devices (PMU and PDC nodes) will automatically appear in the NetSim design environment on System 2, and their routing tables are updated to force traffic through NetSim.

Once baseline communication is established between the Source and Destination, setting up NetSim Cyber is the next critical step.
Step 3: Attack Injection
In the NetSim Design window, locate the Agent node positioned between your newly added Real Nodes.
The Agent Properties panel was accessed.
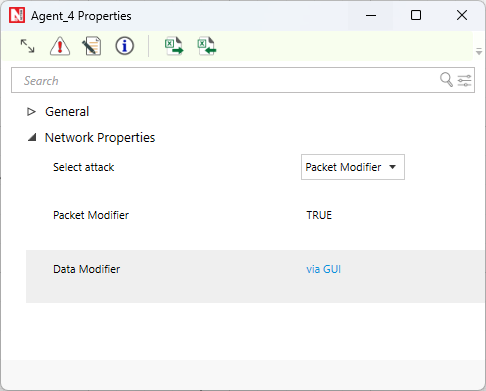
In the “Data Modifier” window via gui that opens, locate the Payload row and check the box to enable it.
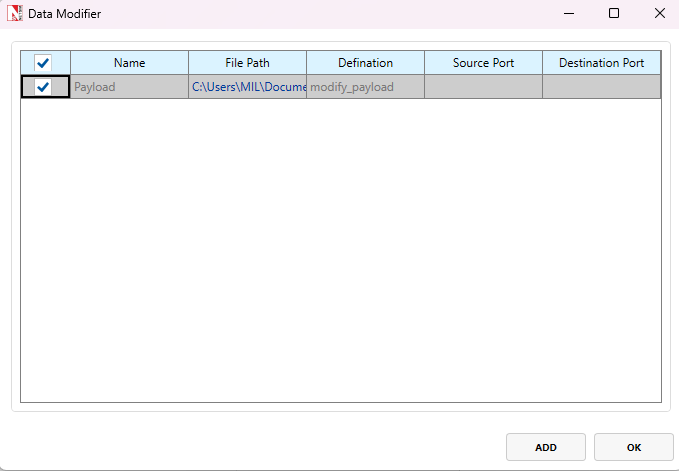
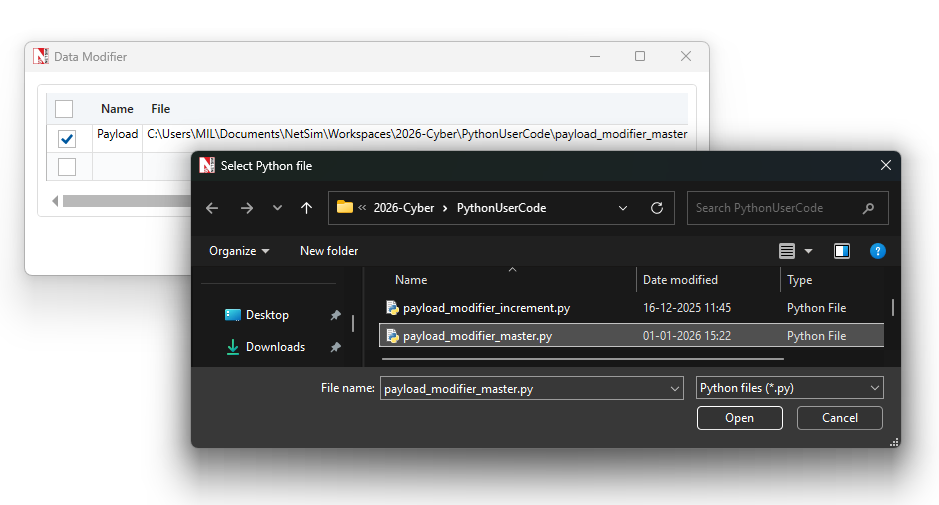
By default, you can simply select the checkbox and click OK. If you want to use a different file, click the Add icon and browse to the required Python file.
Select the master control script:
payload_modifier_master.py(located in your workspace’s PythonUserCode folder).Click OK to save the configuration.
Note: To configure a data modification rule, you
must specify a Name (unique identifier), a File Path (location of the
script), and a Definition (the specific logic within the file to
execute). Example: In our case, the Name is set to payload
and the Definition is set to modify-payload, as defined in
our Python script.
Step 4: Setting up a traffic filter
Click on the Application icon from rapid configurator from the top toolbar.
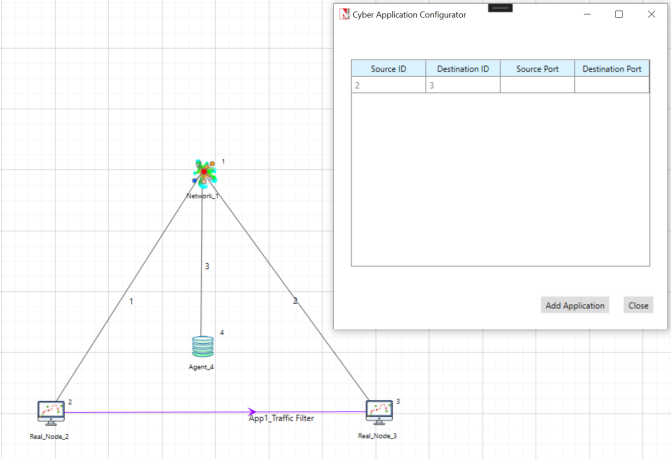
Application needs to be configured from source and destination and click on add application.
Note: If you are utilizing the Method 1: Manual Route Configuration described in the Lab Setup 7.1.1.
Step 5: Run Simulation
Click Run: Press the Run Simulation button in the NetSim toolbar.
Two windows will launch on System 2:
NetSim Cyber Console: A black command-line window for logs.
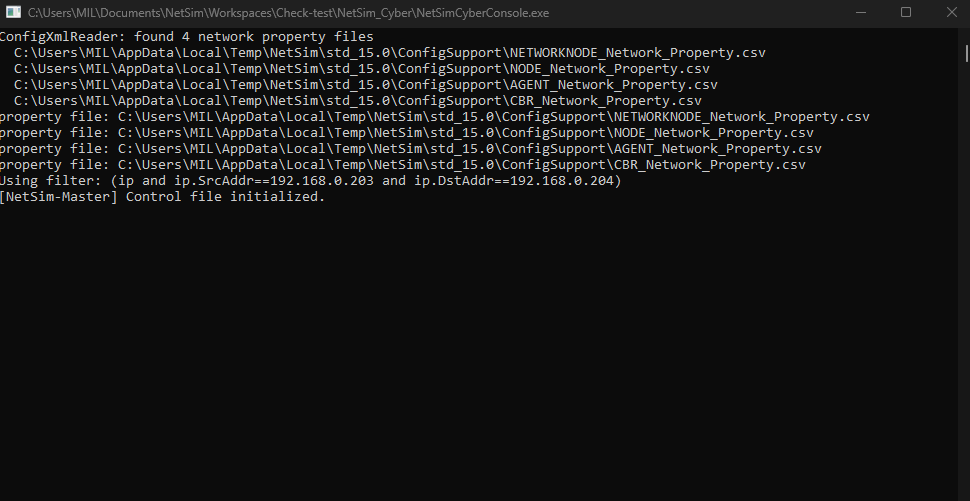
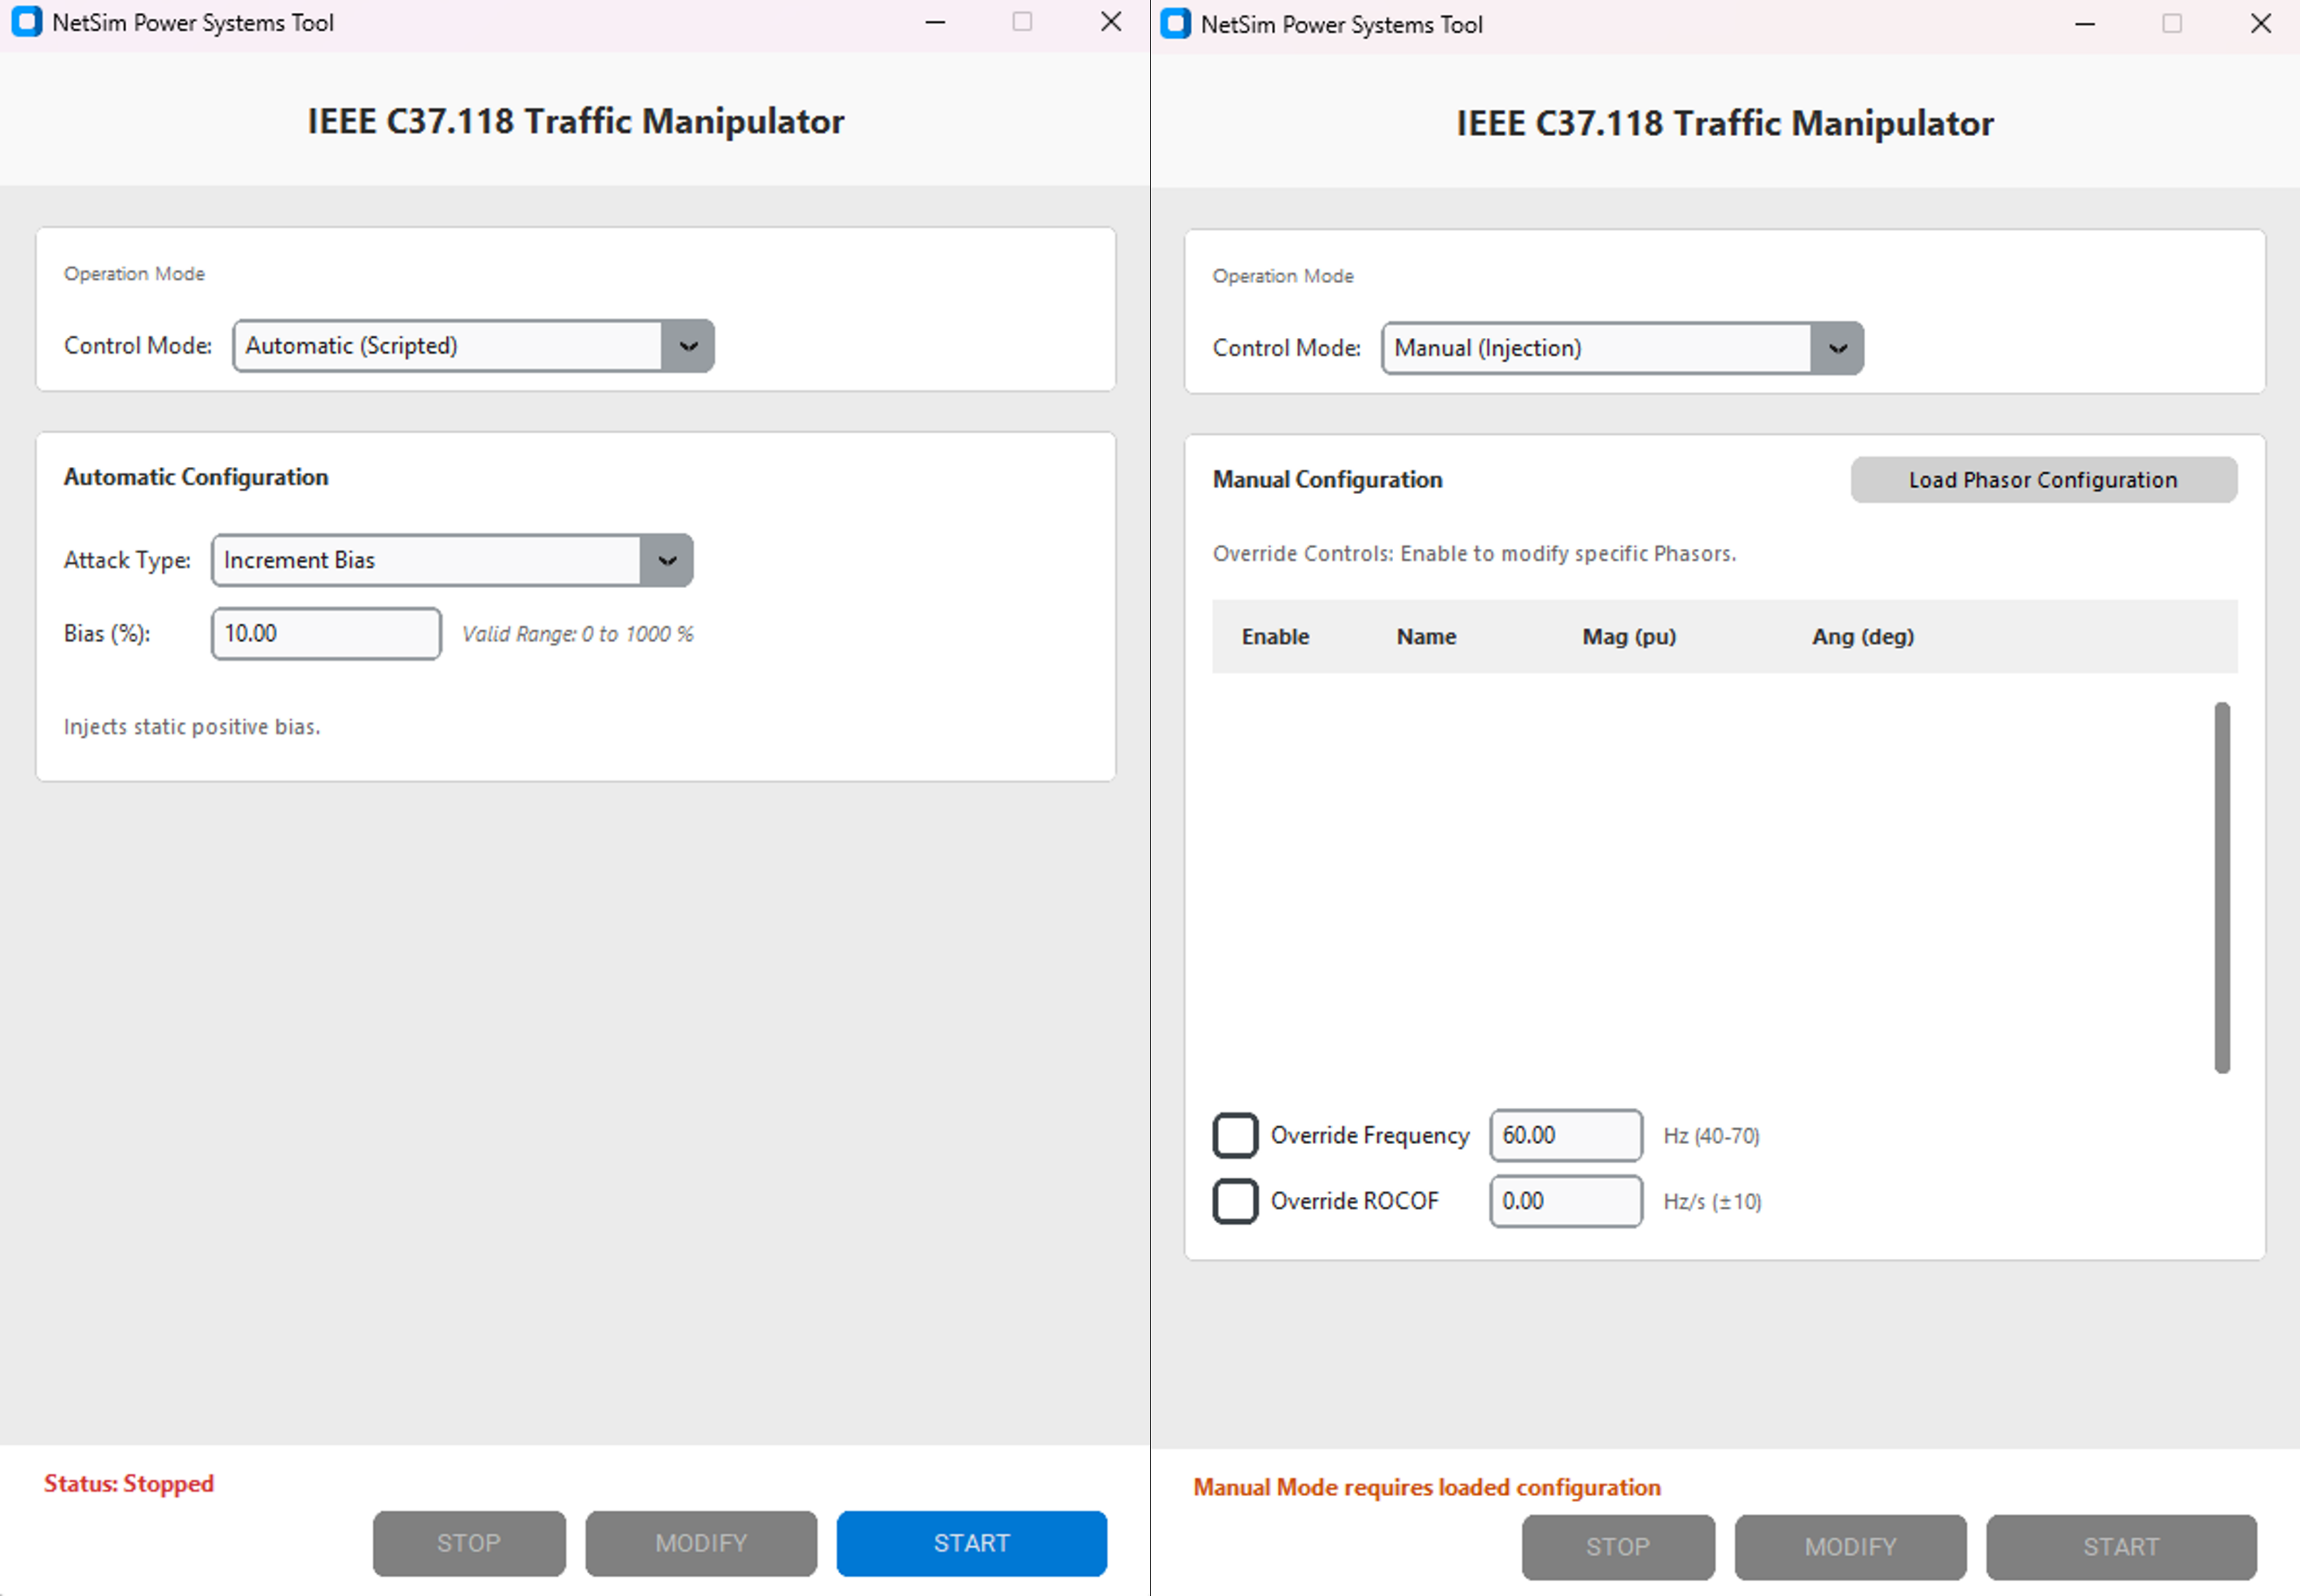
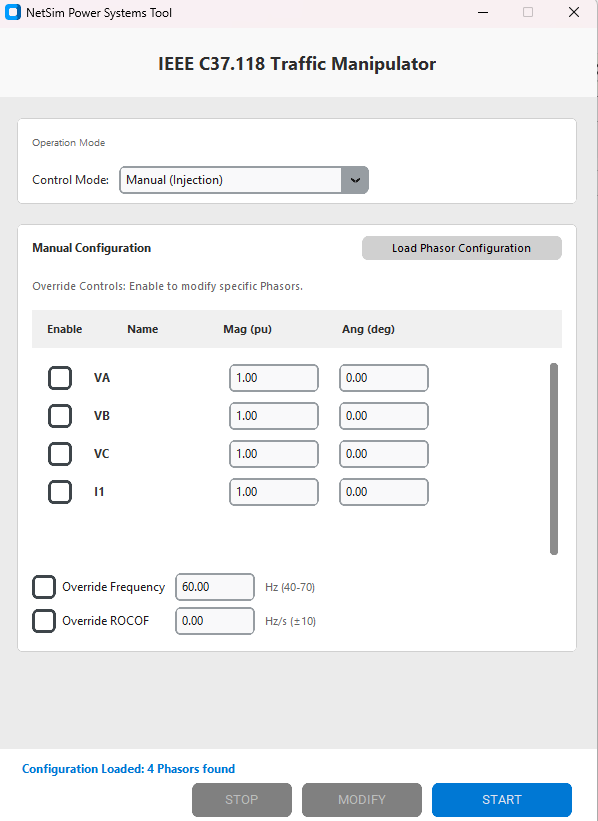
Attack Dashboard: The GUI with Dropdown option for different attack types (e.g., Pulse, Ramp). Which also has Automatic and Manual mode.
The NetSim network is now live and waiting for traffic; we can setup PMU and PDC.
Note: In manual mode, the phasor configuration information is only loaded once the PMU and PDC start communicating. The simulation must intercept the live Configuration Frame (CFG) from the handshake to populate these settings.
Step 6: PMU Initialization (System 1)
Navigate to the Pypmu master folder on System 1.
Double-click the
run_gui.batfile to launch the PMU Launcher interface.By default, the IP address is set to the loopback address. For multi-system testing, configure the IP address to match the actual IP of the system running the PMU (e.g., if the PMU runs on 192.168.0.26, use 192.168.0.26).
Click the Start PMU Simulator button.
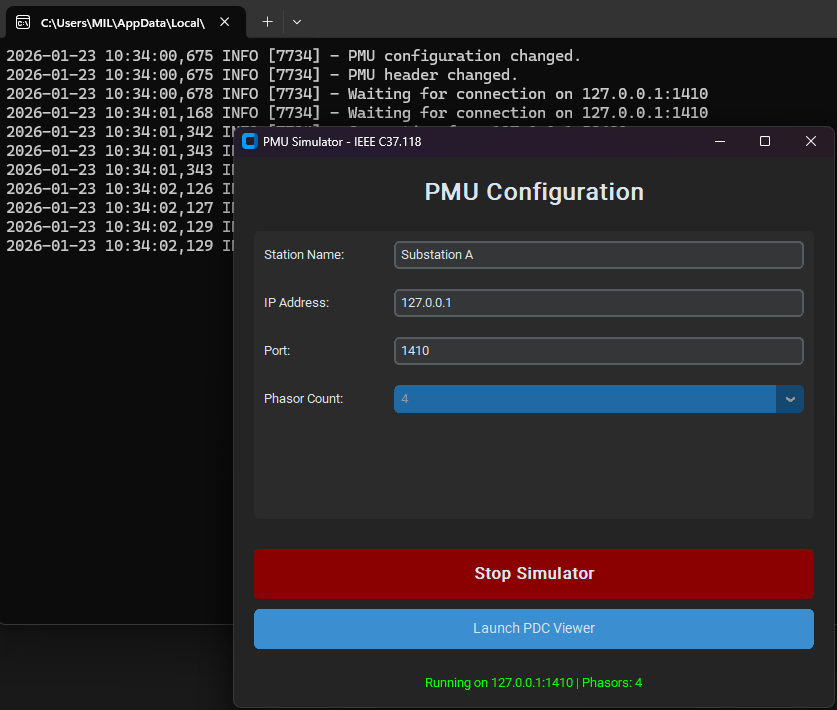
A terminal window will appear. Verify it displays:
Waiting for connection on....
Step 7: Connect PDC & Verify NetSim (System 3 & 2)
Import Configuration (OpenPDC Manager)
Ensure the provided
PMU_Connection.xmlfile is accessible on System 3.Launch the OpenPDC Manager on System 3.
On the Home screen, click the Input Device Wizard button in the “Quick Links” panel.
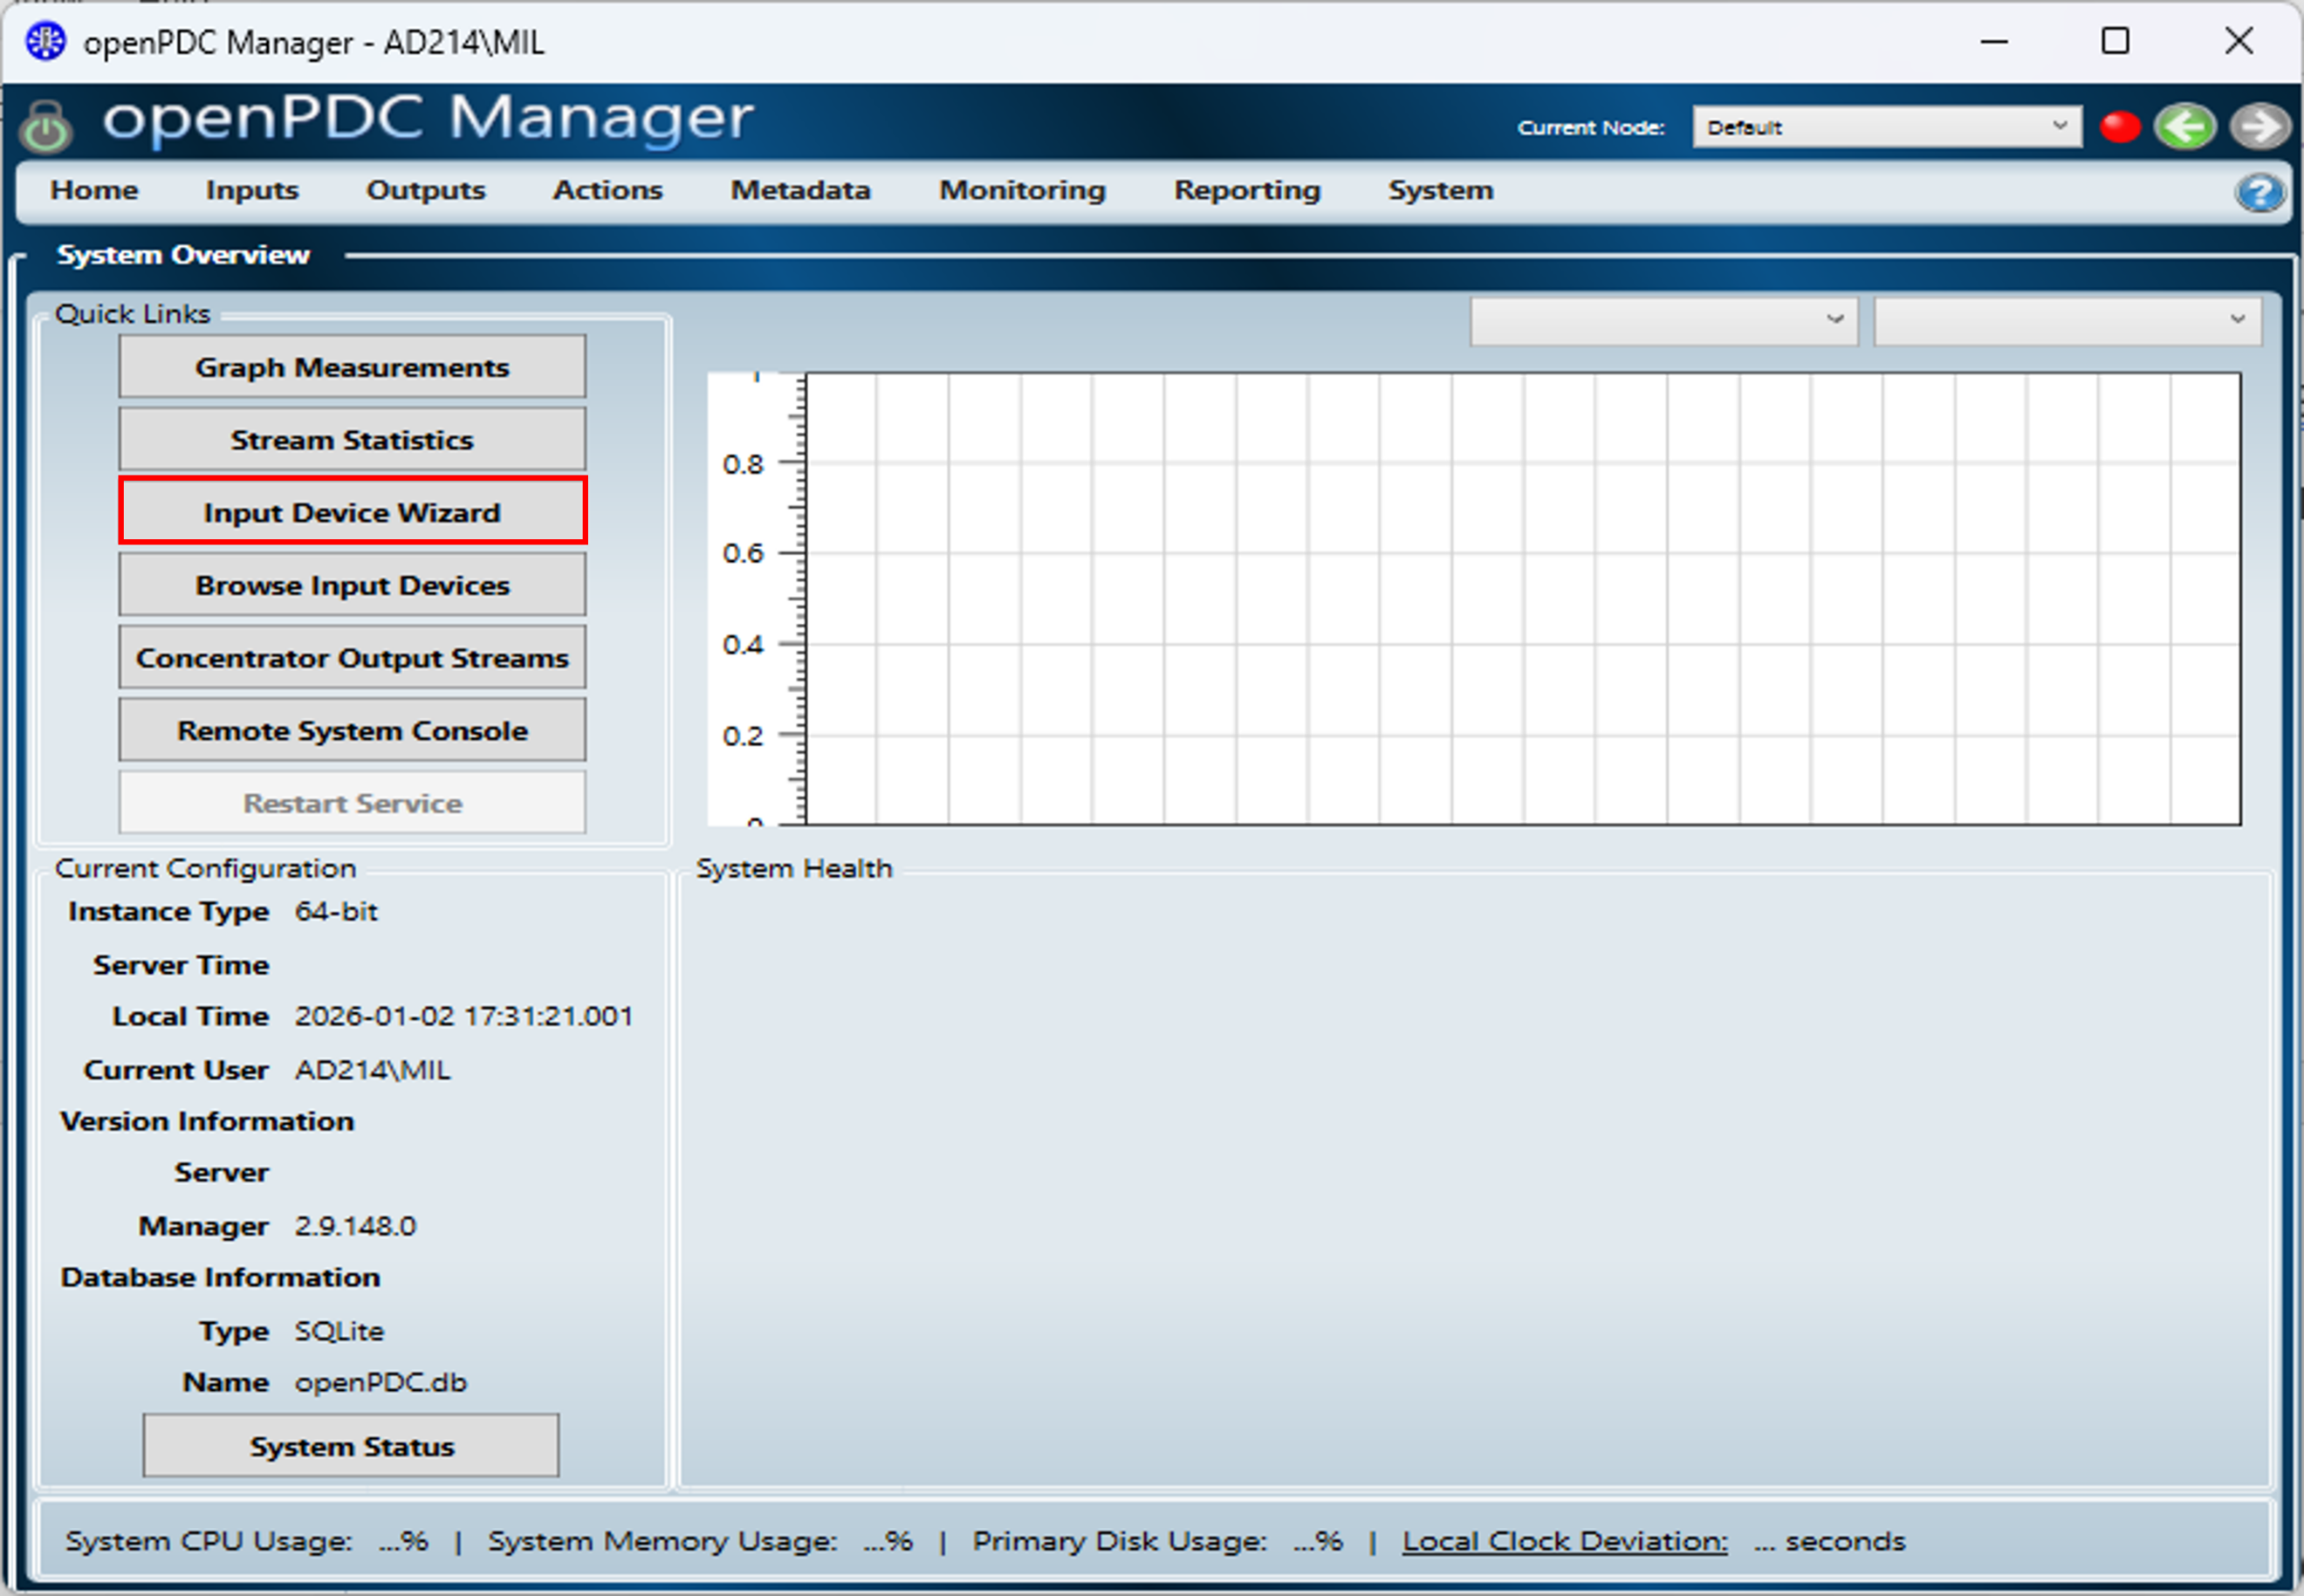
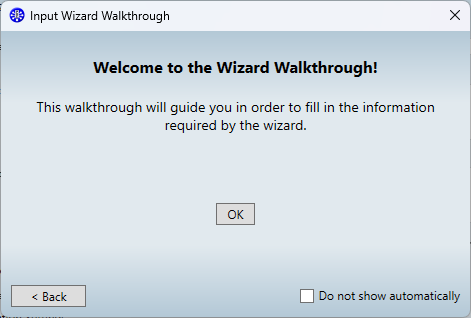
A popup titled “Welcome to the Wizard Walkthrough” may appear. Close this popup to proceed manually.
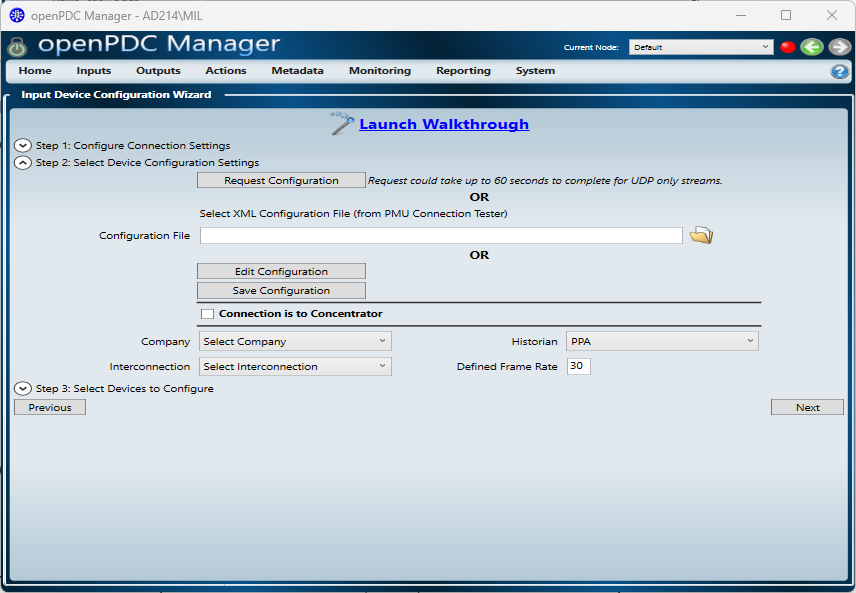
In the Wizard, locate the section Step 2: Select Device Configuration Settings.
Find the field labeled “Configuration File”. Click the folder icon to browse and select the pre-configured
PMU_Connection.xmlfile provided with the lab files.
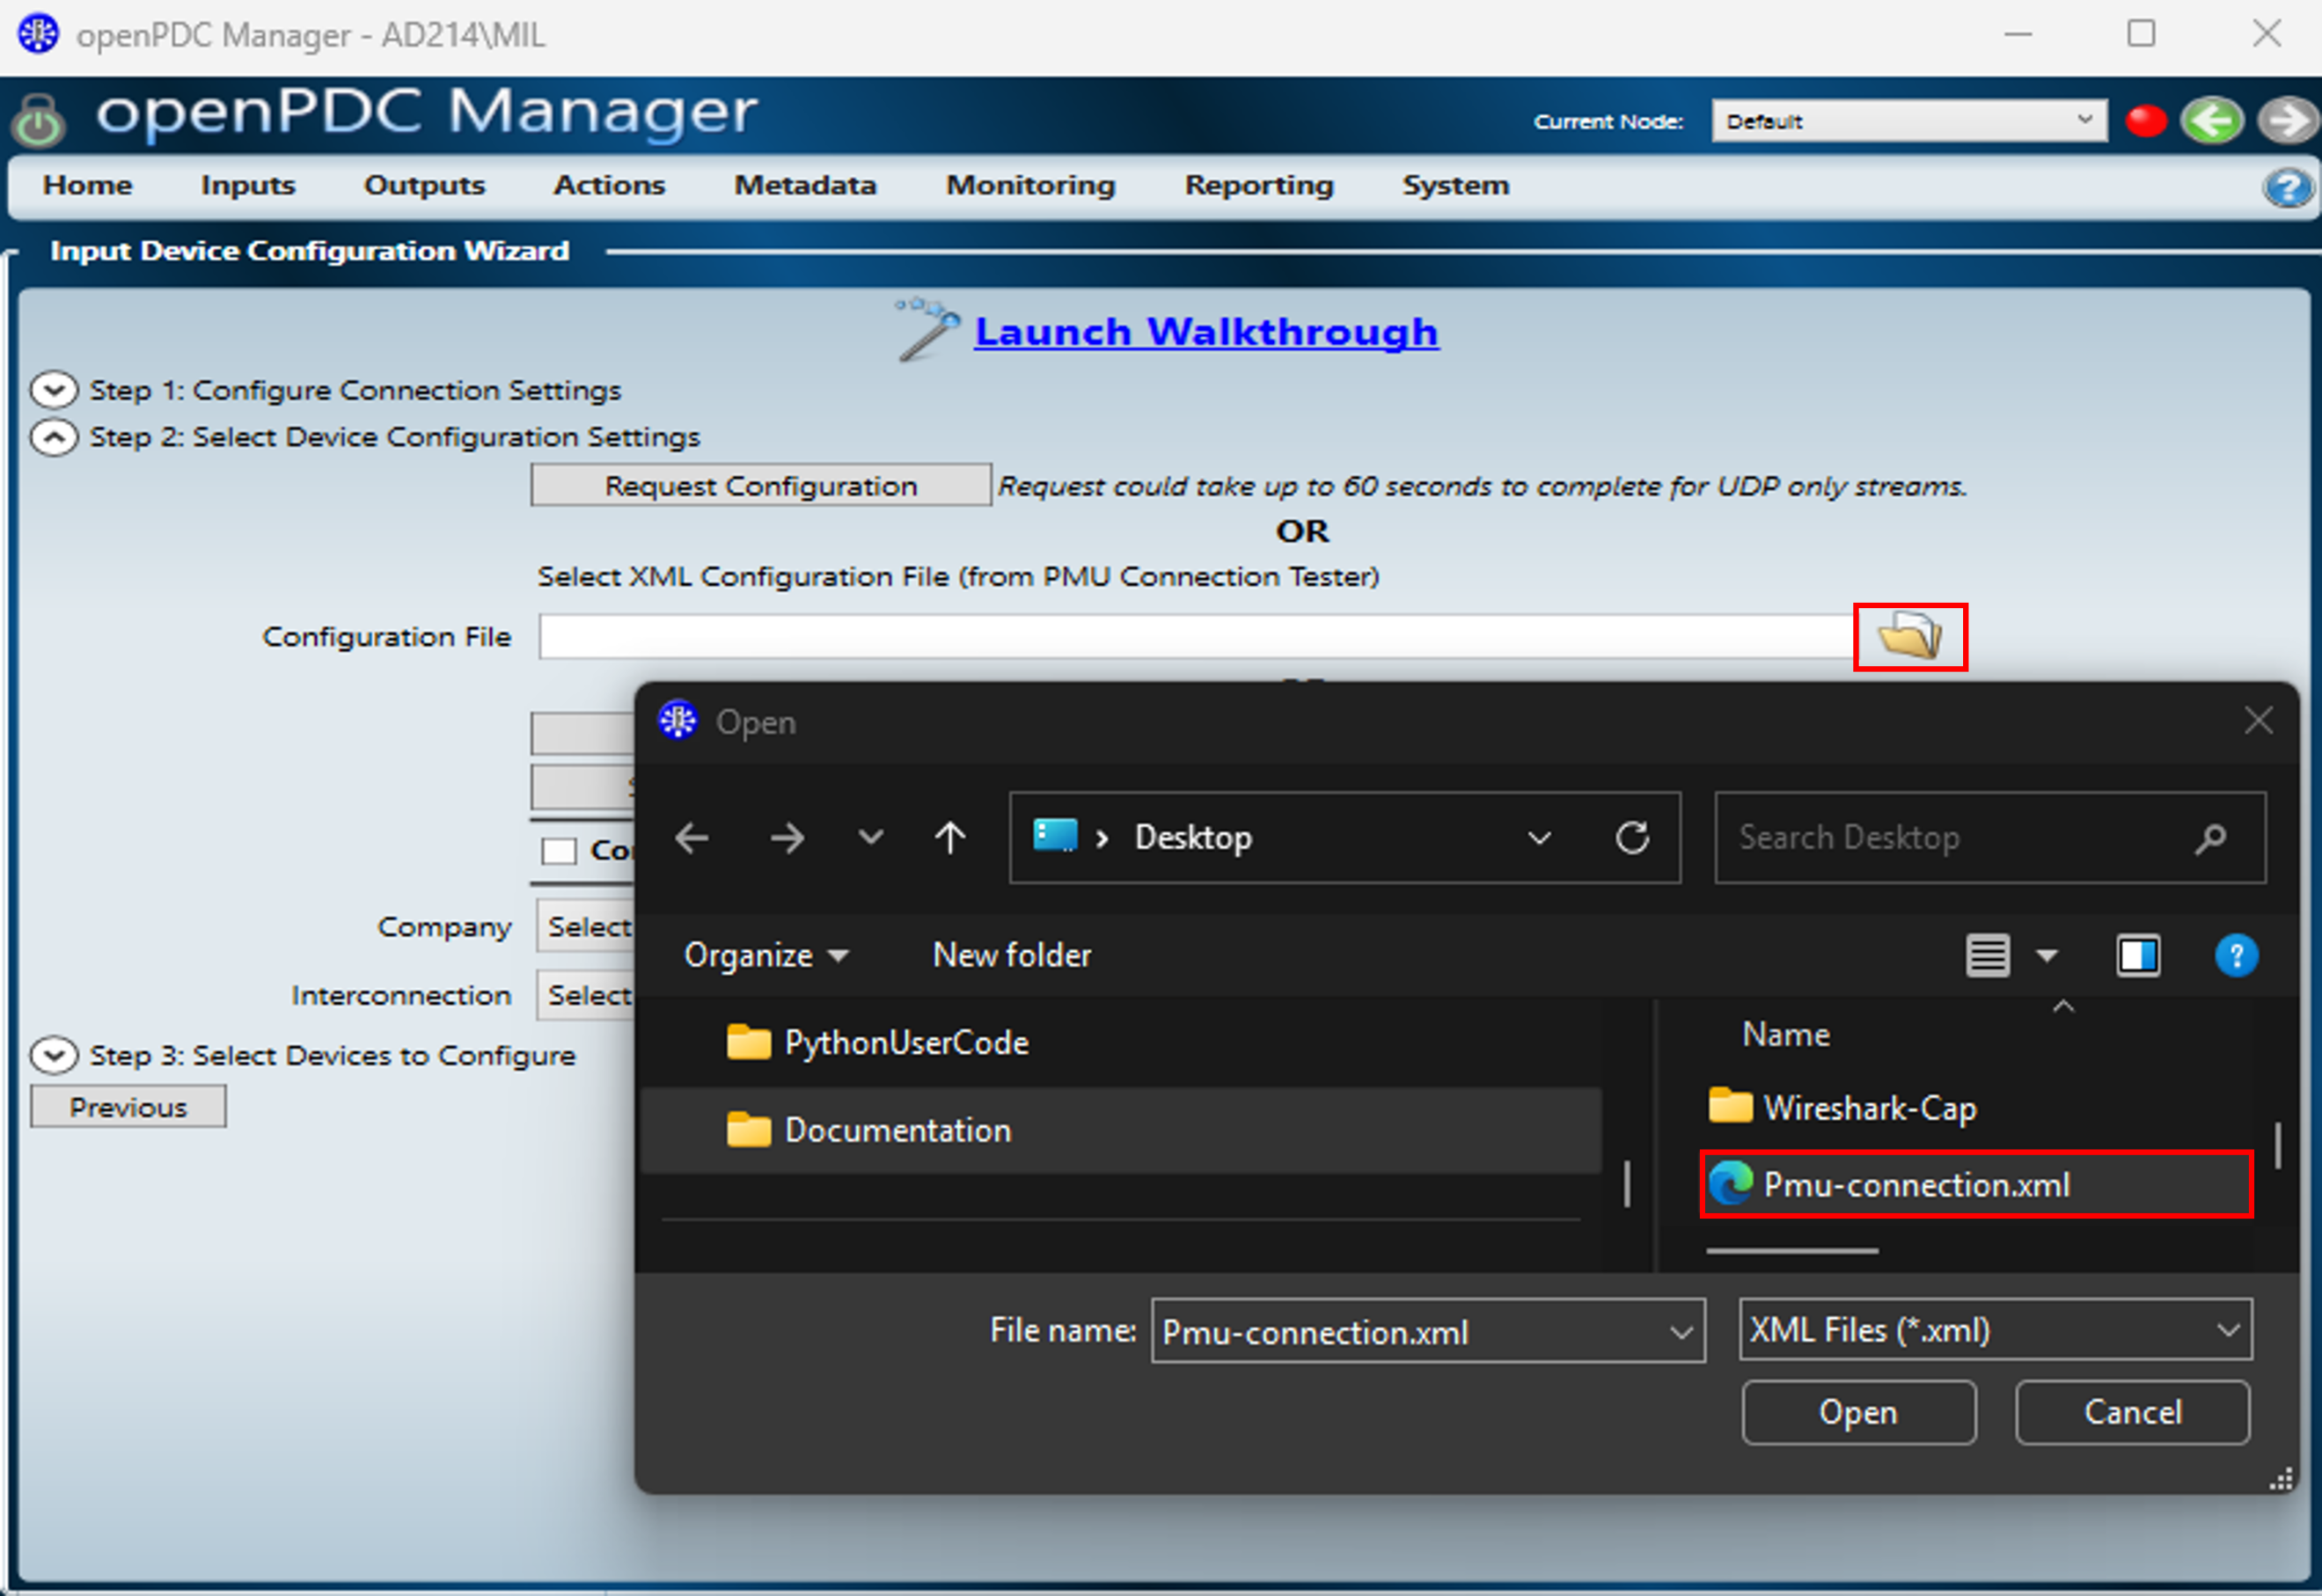
Click Next.
The wizard will advance to Step 3: Select Devices to Configure. Verify that your device (e.g., “STATION_A”) is listed and checked.
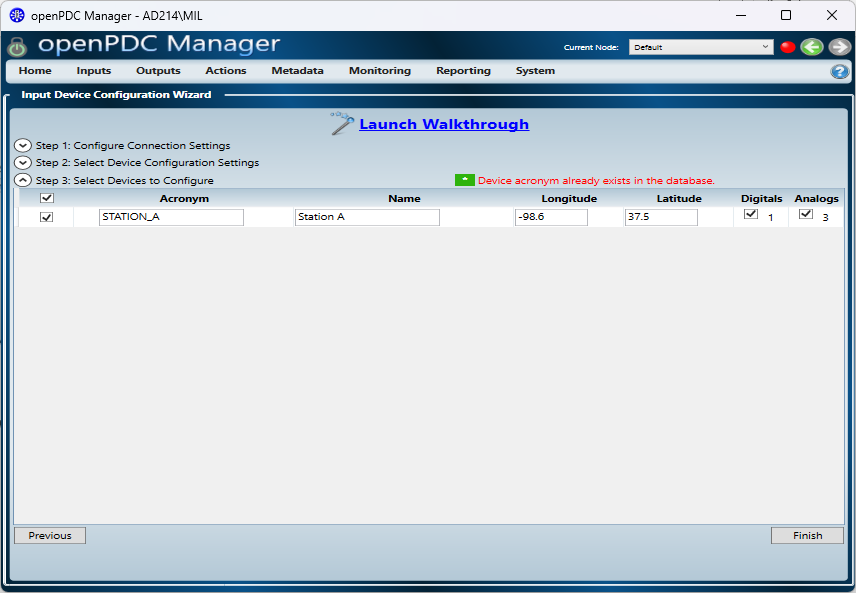
Click Finish.
Configure Phasor Units
After the wizard closes, navigate to Inputs \(\rightarrow\) Browse Input Devices in the top menu.
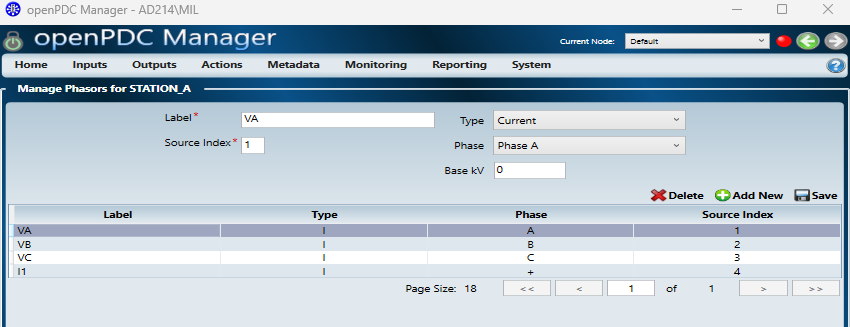
Click on phasors the newly added device (e.g., STATION_A) to open its settings.
In the Manage phasors settings window, locate the rows for VA, VB, and VC.
Manually change the Type drop-down for all three phases from “Current” to Voltage one by one and save those settings.
Verify Live Data
Navigate to Home \(\rightarrow\) Graph Measurements.
Expand Directed connected, and select Station_A and Edit.
Locate the Connection String input field (often found at the top of the graph window or under a “Settings” tab).
Enter the following string to explicitly point the graph to your PMU source:
transport=Tcp; server=192.168.0.83; port=1410
(Note: Replace 192.168.0.83 with the actual IP address of your System 1 if different).
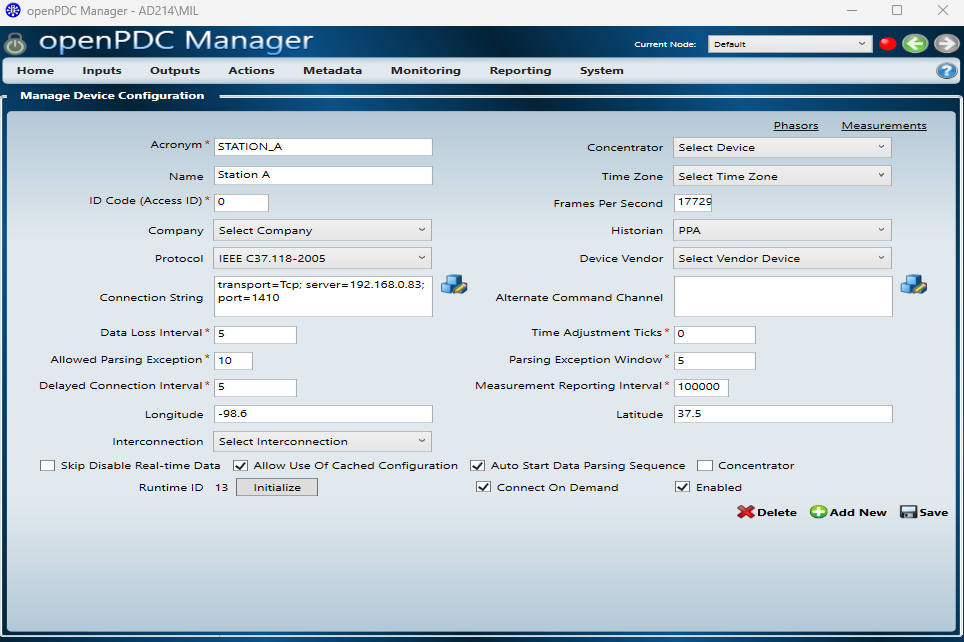
Click Save.
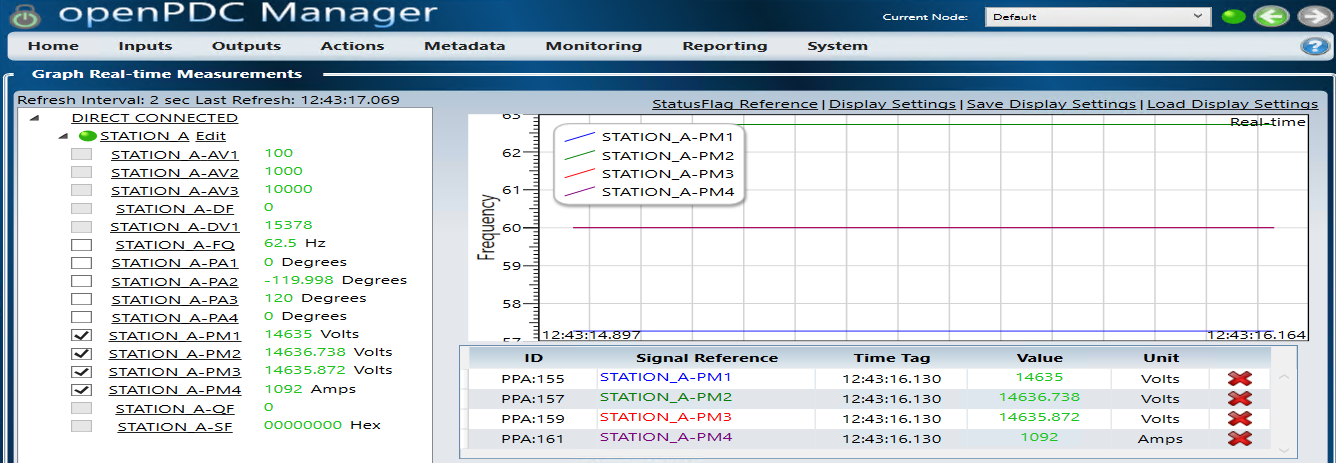
Confirm that the voltage and frequency graphs display a stable, flat line (e.g., 62.5 Hz / 14635 Volts).
Immediately check the NetSim Cyber Console (black window) on System 2.
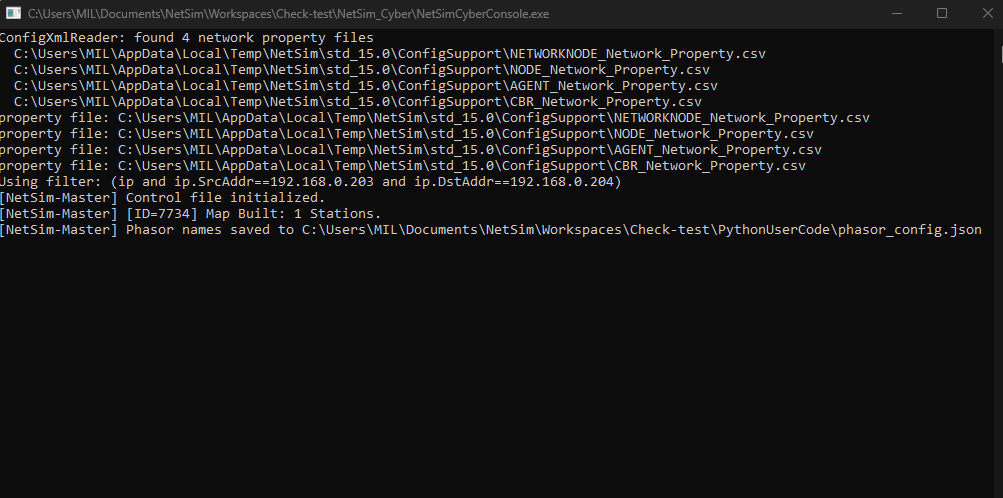
The console will display a MapBuilt with number of stations present; also phasor names will be saved to JSON file which will later be loaded in manual mode UI.
Only after seeing this confirmation can you proceed to attack injection in manual or automatic mode.
Step 8: Data Visualization (System 3)
The OpenPDC dashboard was observed for immediate deviations. In the below example, we have performed a random noise attack.
Screenshots of the real-time graph were captured as evidence of the attack’s successful execution.
Results and Analysis
To check the impact of the cyber-threats, the system was monitored under two distinct conditions: baseline state and a multi-vector attack scenario.
Normal Operation
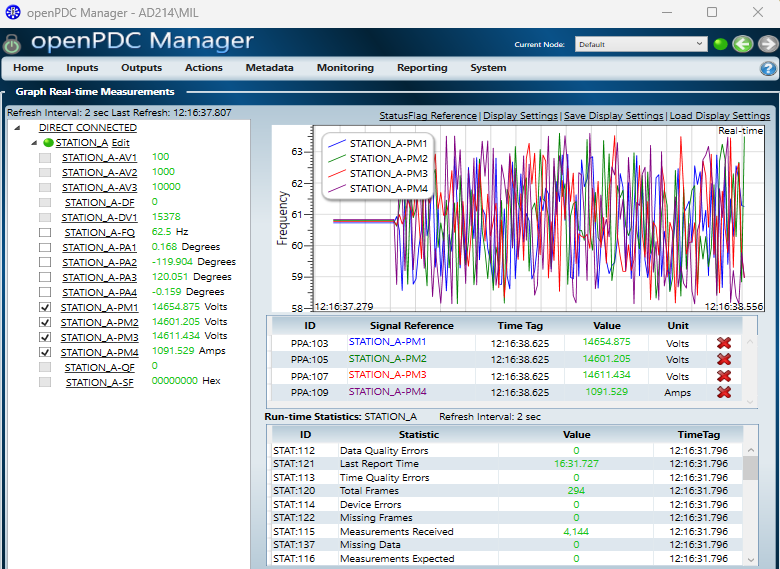
The system was first operated without any active attack agents. The OpenPDC “Real-Time Measurements” dashboard confirmed the successful reception of the IEEE C37.118 data stream from the Python simulator.
Without Attack
We observe that the data is of constant value from pypmu simulator:
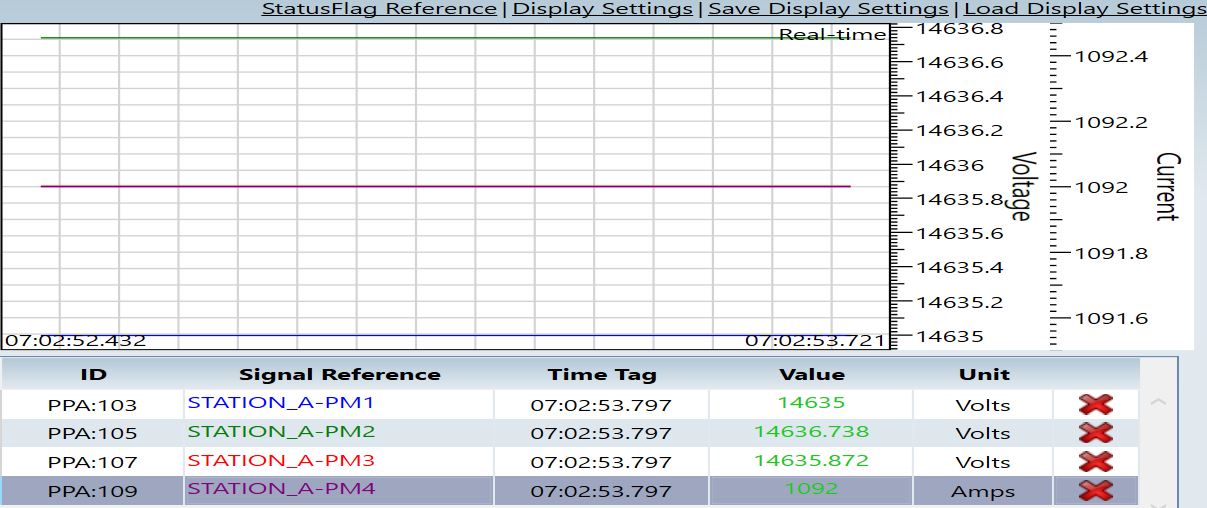
Voltage Stability: The voltage magnitude across the monitored phases (PM1, PM2, PM3) held steady at approximately 14.6 kV (ranging from 14,635 V to 14,636.7 V).
Current Load: The current measurement (PM4) remained constant at 1092 Amps, indicating a stable load condition.
With Attack
Attack Impact Analysis
The NetSim Agent was configured to inject five distinct payload modification attacks.
This set of attacks targets the integrity of synchrophasor measurements by deliberately altering voltage and current values in different temporal patterns. Such manipulations can mimic realistic power system disturbances, making them difficult to distinguish from genuine events using simple threshold-based monitoring.
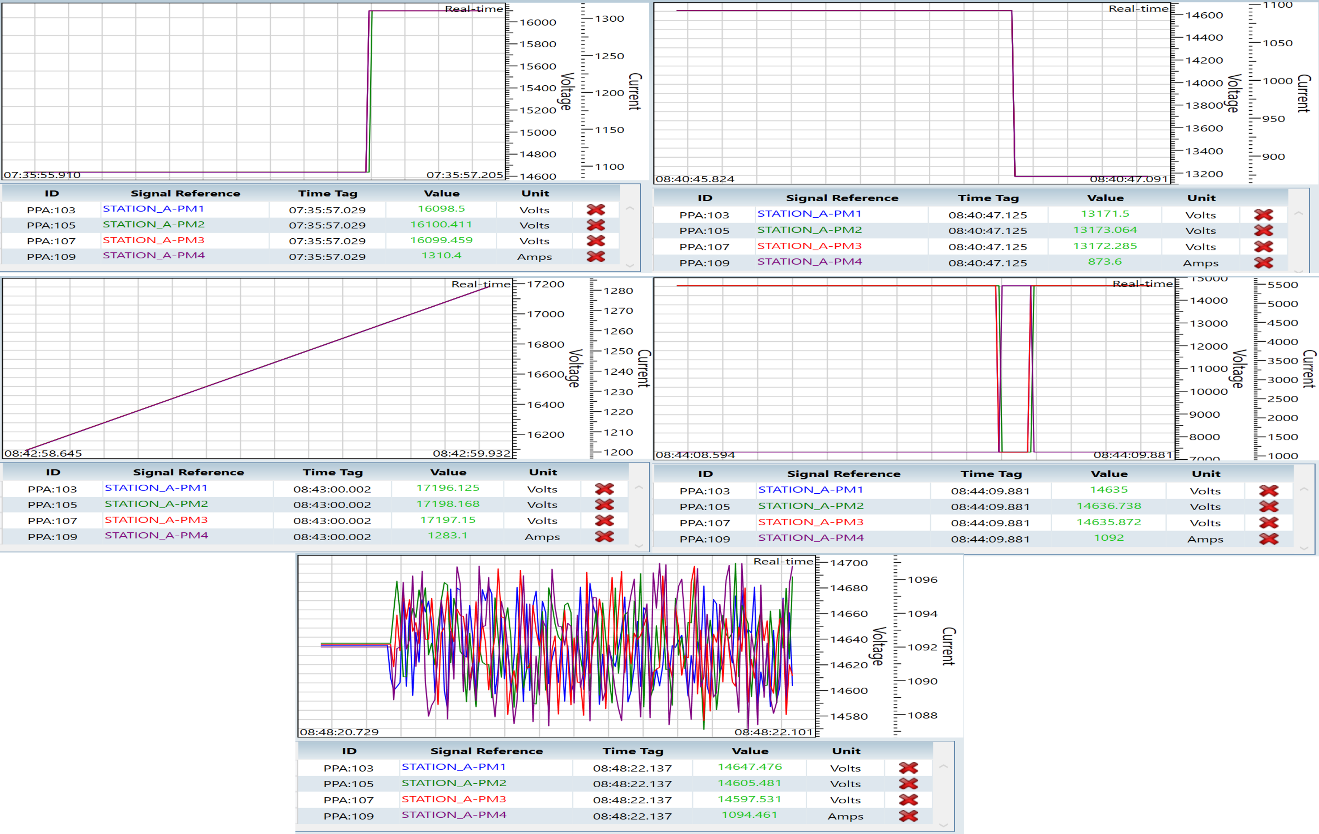
Increment / Decrement Manipulation
Sudden step changes in measurement values that appear as legitimate operating shifts.
Ramp Manipulation
Gradual bias injection that closely resembles slow-moving system drift or load variation.
Random Noise Injection
Low-amplitude fluctuations that degrade measurement quality while remaining protocol-compliant.
Pulse / Surge Injection
Short-duration spikes that mimic transient disturbances or fault-like events.
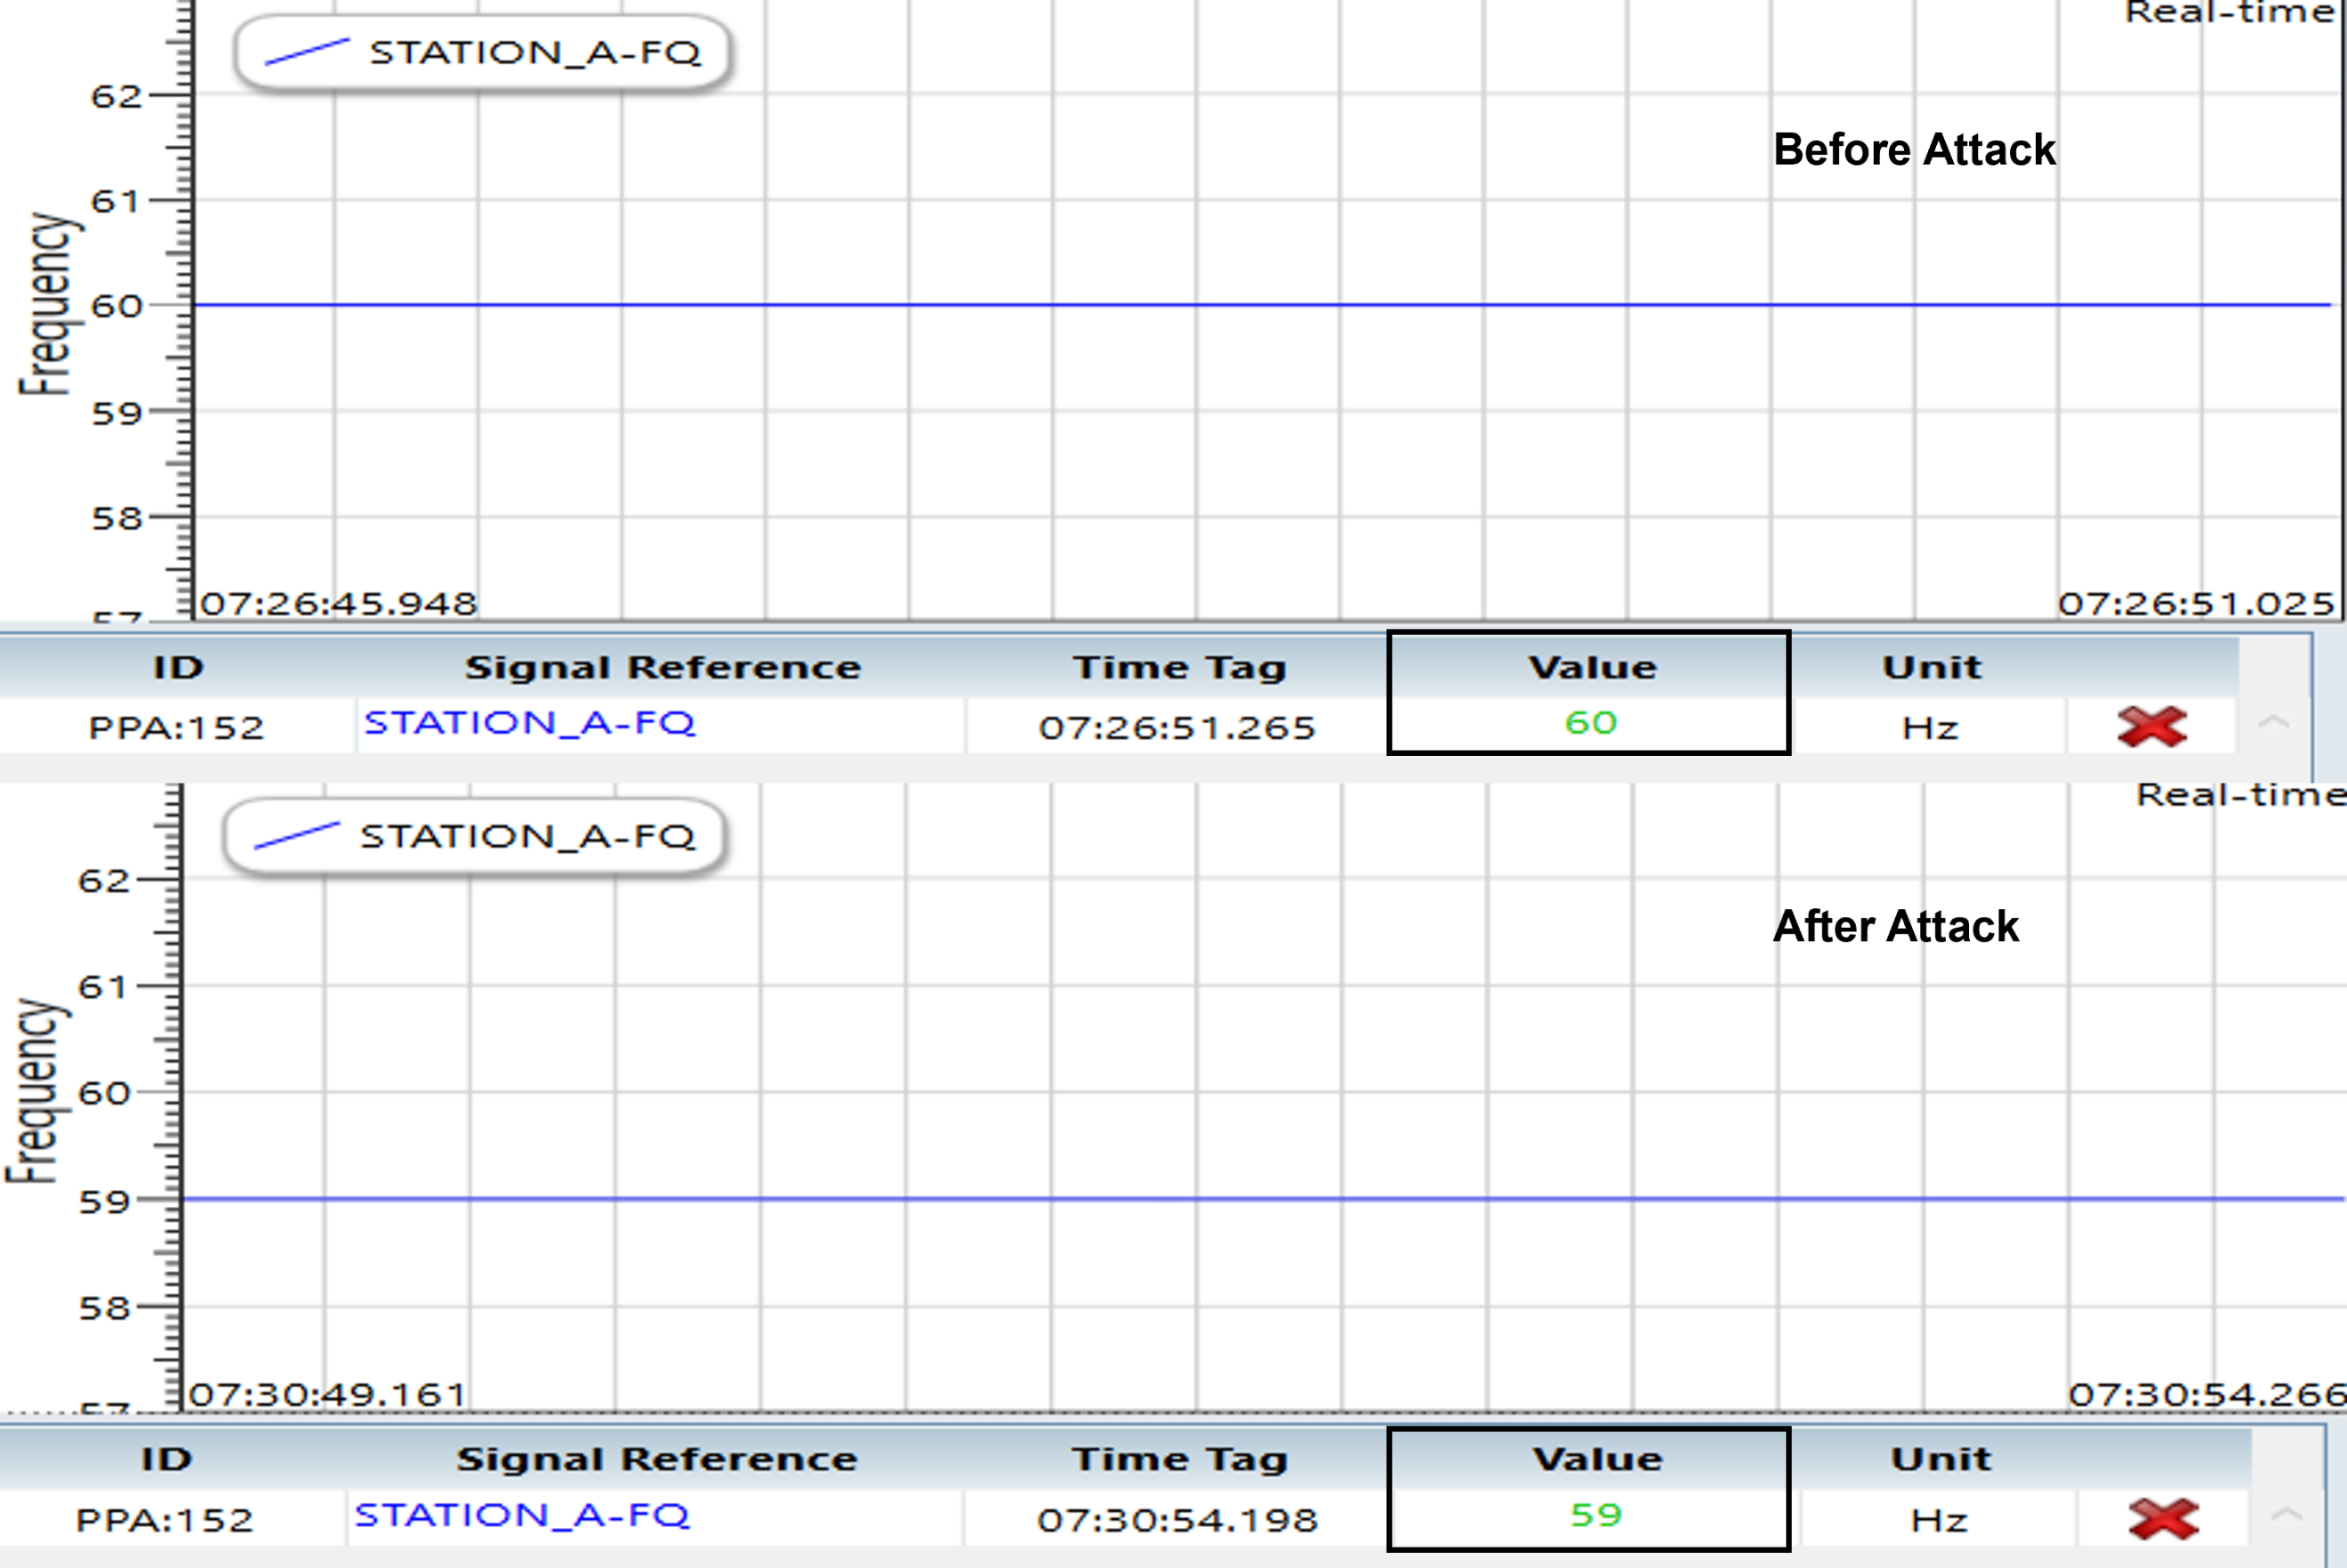
Frequency/ROCOF Attack:
In this attack scenario, the adversary manipulates the frequency (and implicitly the Rate of Change of Frequency, ROCOF) values in the synchrophasor data stream without disrupting communication. Such attacks can mislead grid monitoring and protection systems by creating false indications of frequency instability or generation–load imbalance.
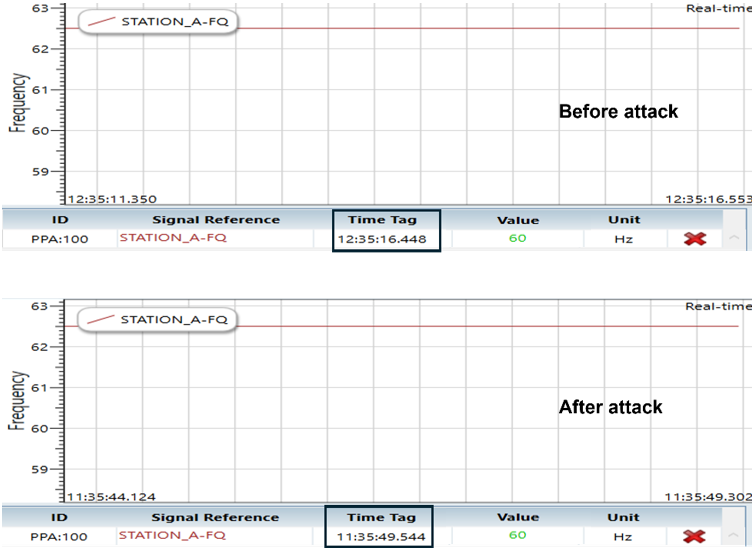
Time Synchronization Attack:
In this attack, the adversary tampers with the timestamp information (time tag) of the synchrophasor data while keeping the actual measurement values unchanged. Such manipulation disrupts temporal alignment across PMUs, which is critical for wide-area monitoring, state estimation, and event correlation in power systems.