Introduction
The 5G NTN library supports end-to-end, full-stack, packet-level simulation of 5G NTN based LEO/MEO satellite networks. The features supported include:
LEO satellite orbits
Altitude: User configurable from 160 to 2000 km.
Standard options: LEO 600, LEO 1200
MEO satellite orbits
Altitude: User configurable from 2000 to 35876 km.
Standard options: MEO 10000, MEO 20000
GEO satellite orbits
Altitude: 35786 km.
Standard option: GEO 35786
Bands
S-band and L-band: n254, n255, n256 (FR1 bands released in 3GPP standards)
Ka Band, Ku Band: n510, n511, n512 (FR2 bands proposed in 3GPP standards)
Earth satellite link and satellite earth link
Channel model and path losses (per TR 38.811)
Propagation delay based on slant distance
Devices
UEs
VSAT with directive antennas
Handhelds (or informally mobiles)
Ground stations, gNBs
5G core and remote servers
Downlink transmissions (Remote server \(>\) gNB \(>\) Satellite \(>\) UE)
Uplink transmissions (UE \(>\) Satellite \(>\) gNB \(>\) Remote server)
Antenna models
Omnidirectional antenna for Handheld UEs
Circular aperture antenna for VSATs and Satellites
Satellite spot beams with earth fixed cells (explained later)
Architecture
Transparent satellite (also termed “bent pipe” operation)
Similar to the NetSim (terrestrial) 5G library, the NTN satellite library allows users to simulate the transmission of data, voice, video, etc., over a LEO/MEO satellite network. After simulation, users can assess key output metrics such as delay, latency, and errors. These results can be viewed in both tabular and graphical formats, from a network-wide overview down to individual links and devices. For in-depth studies, NetSim can log detailed radio measurements and resource allocations as well as trace individual packet flow and individual event execution.
Single transparent satellite fixed in a LEO orbit with terrestrial UEs and gNB
Single satellite simulation per 3GPP TR 38.821
The satellite remains fixed in orbit; users can configure the orbital height.
UE elevation angle is computed per the UE’s position.
Fixed-earth spot beams. UEs will connect to the beam with the highest PDSCH SNR.
Ground station and gNB are located at an arbitrary point outside the service beams and communicate with the satellite via a feeder link.
UEs transmit/receive data from remote servers and the connectivity is UE \(\leftrightarrow\) Satellite \(\leftrightarrow\) Gateway \(\leftrightarrow\) gNB \(\leftrightarrow\) 5G Core \(\leftrightarrow\) Remote servers.
UEs can be mobile and inter-beam handovers can occur.
UEs are handheld devices (e.g., Power Class 3) operating in FR1, i.e., the S or L band. VSAT terminals can connect in FR1 or FR2 bands.
The UE terminals are assumed to be equipped with a GNSS receiver, thus able to estimate their location.
RAN Architecture with a transparent satellite (NTN A1 mode)
The diagrams below show a typical satellite NTN scenario based on transparent payload architecture


A feeder link is a radio communication link between a gateway and the satellite. It is a single beam of full bandwidth.
A service link is a radio communication link between the user equipment and the satellite. The service link comprises multiple spot beams that cover a given area. The bandwidth of the beams depends on the frequency reuse factor.

A satellite, which implements a transparent payload, performs radio frequency filtering, frequency conversion and amplification; hence, the waveform signal repeated by the payload is unchanged except for frequency translation and transmit power.


Earth fixed spot beams and cells
The satellite beams point towards the ground in a hexagonal manner similar to the canonical evaluation setup with hexagonal tessellation used for terrestrial cellular networks. NetSim supports earth-fixed beams.
In earth-fixed beams, the satellite beams are steered such that they always point to the same location on earth.
The ability to adjust these beams is constrained by the satellite’s elevation angle. It must stay above a specified minimum value on either side of the horizon for uninterrupted connectivity. Practically, when the elevation hits its limit, the beams shift to another Earth location. The beams stay fixed on that location for a set duration before moving to another, and this cycle repeats.
The adjustment of these beams is limited by the satellite’s beam radius and the number of beams configured by the user.
The fixed-beam scenario yields the maximum time a UE may remain under the coverage area of the same satellite. This time is the time the satellite remains above the horizon relative to the UE location. This is usually of the order of \(7\) to \(10\) minutes.
Unlike fixed beams, “Moving beams” follow the motion of the satellite and move over the Earth’s surface. This is not currently supported in NetSim.
Mapping of satellite beams to terrestrial cells is one-to-one. Each beam is one physical cell.
Number of spot beams.
NetSim can presently support configurations of 1, 7, or 19 spot beams with custom placement. Users can drop an arbitrary number of beams based on their requirement.
The 7-cell setup consists of a central hexagonal cell surrounded by 6 adjacent cells.
The 19-cell configuration has two layers of surrounding cells around a central hexagonal cell.
NetSim automatically computes the tessellated beams (cells) based on the number of spot beams.
NetSim supports the NR-Uu radio interface on the service link between the satellite and the UE.
Cell/Beam Layouts
NetSim supports 1 cell, 7 cell and 19 cell layouts. The beam diameter which is also the inter-beam distance on earth is a user input. The beams would be circular, but the tessellation would be hexagonal. The centre of all the cells can be calculated from basic trigonometry.
Beam diameter to inter-cell distance
Let the beam diameter be \(D\), which is a user input. Then the distance between the centre of two adjacent hexagons whose circumcircle has a diameter \(D\) can be obtained from basic trigonometry. Since \(\frac{\frac{ISD}{2}}{\frac{D}{2}}=\cos(30),\) we obtain \(ISD=\frac{\sqrt{3}\times D}{2}\).
Feeder Link
The feeder link is used for communication between the satellite and the terrestrial gNB. The frequency reuse options discussed are pertinent to the service link. For the feeder link, NetSim models a single spot beam of full bandwidth pointed towards the terrestrial gNB. NetSim supports Satellite Radio Interface (SRI) on the feeder link between the NTN gateway and the satellite. The SRI transports the F1 protocol.
Per TR 38821, Table 6.1.1.1-5, NOTE 1, “Typical impairment values (additional frequency error, SNR loss) due to the feeder link except for delay can be considered to be negligible”. Therefore, in NetSim, we assume the feeder link to have NIL SNR losses. The only factor we consider and model over this link is latency.
Bent pipe operation
Bent pipe satellites are typically used to relay information. Data received by the satellite on its reception interface is simply transmitted by the satellite on its transmission interface without modifying the data. Given that we model NIL SNR loss on the feeder link the link budget computations are only carried out on the service link.
Angle between the antenna boresight to the line joining the UE and the satellite
The cell diameter \(D\) is a user-defined parameter. The beam positions are based on the cell diameter and the number of beams configured. \(\theta\) is defined as the angle subtended between the selected beam and the UE from the satellite. It is computed by forming vectors:
Satellite-to-Beam (centre) vector \(\hat{\rho_{c}}\)
Satellite-to-UE vector \(\hat{\rho_{u}}\)
The angle \(\theta\) is determined using the dot product formula:
\[\begin{equation} \theta =\cos^{-1}\!\left(\frac{\hat{\rho_{c}}\cdot\hat{\rho_{u}}}{\|\hat{\rho_{c}}\|\,\|\hat{\rho_{u}}\|}\right) \end{equation}\]
where:
\(\hat{\rho_{c}}\cdot\hat{\rho_{u}}\) is the dot product of the vectors, and
\(\left\|\hat{\rho_{c}}\right\|, \|\hat{\rho_{u}}\|\) are the magnitude of the respective vectors.
Bands
Release 17 has three new bands for LEO NTN.
n256 (S-Band): UL 1980 – 2010 MHz, DL: 2170 – 2200 MHz. FDD
n255 (L-Band): UL 1626.5 – 1660.5 MHz, DL: 1525 – 1559 MHz. FDD
n254: UL 1610 – 1626.5 MHz, DL: 2483.5–2500 MHz. FDD
Release 18 NTN bands in FR2
n512: UL 27.5–30.0 GHz; DL 17.3–20.2 GHz FDD
n511: UL 28.35–30.0 GHz; DL 17.3–20.2 GHz FDD
n510: UL 27.5–28.35 GHz; DL 17.3–20.2 GHz FDD
With 3GPP Rel-18, additional spectrum in Ka band offers much higher speed – to the order of hundreds of Mbps – to non-handheld devices using small dish antennas, similar to that offered by SpaceX’s Starlink service.
Note that:
UEs can connect only on FR1 bands
VSAT terminals can connect on FR1 and FR2 bands
Sub carrier spacing
Rel 17 allows for SCS of UL signals lower than 60 kHz (in FR1)
GUI parameters
Grid size:
Min: 50km \(\times\) 50 km
Max: 150 km \(\times\) 150 km
Square or rectangular configurations
Satellite type:
Options: LEO, MEO
Altitude (per Table 4.5.1, 38.811)
LEO: 160 km to 2000 km. Standard options: 600 km, 1200 km.
MEO: 2000 km to 35876 km. Standard options: 10000 km, 20000 km.
Service link
Number of beams on the service link
Options: 1, 7, 19
Frequency reuse factor
Options: 1, 3
Beam diameter // Reference Table 4.6.1, 38.811
LEO: 5km to 200 km. Default: 50 km
MEO: 100 km to 500 km. Default: 200 km.
\(EIRP\) is the effective isotropic radiated power in dBW
\(\frac{G_{rx}}{T}\) is the antenna-gain-to-noise temperature in dB/K of the receiver
k is the Boltzmann constant with the value of -228.6 dBW/K/Hz. Fixed.
Channel
Pathloss model. Fixed to Free Space. Using this model we obtain, \(PL_{FS}\) the free space path loss (FSPL) in dB.
Shadow Margin, \(PL_{SM}\) in dB. Enable and disable options in the GUI. If enabled then the log normal shadowing model is applied; the standard deviation of the distribution is obtained from tables available at section 6.6.2 of 3GPP 38.811, based on the LOS probability, elevation angle, and scenario type (urban, rural, or dense urban).
Scintillation loss, \(PL_{SL}\) in dB. Range [0.0, 10.0]. Default [1.1]
Additional loss, \(PL_{AD}\) in dB. Range [0.0, 10.0]. Default [8]
Interference. Enable and disable options in the GUI. If enabled then Carrier to Interference Ratio, CIR in dB. Range [-30, +50]. Default [5]
Channel bandwidth, \(BW\) in Hz from which we obtain \(B,\) is the channel bandwidth in dBHz (i.e., \(10\log_{10}(BW),\) where \(BW\) is bandwidth in Hz). Options
FR1 – 5, 10, 15, 20, 30 (MHz)
FR2 – 50, 100, 200, 400 (MHz)
Antenna
Satellite Max Receive Gain
Note that transmit gain is assumed to be included in the EIRP
UE Transmit power: 23 dBm
Terrestrial environment: Dense urban, urban, rural
Frequency Reuse
In the NETSIM GUI, users can configure the number of beams and select the frequency reuse factor accordingly. This selection determines the channel ID assignment for all beams.
Once configured, the NetSim GUI generates a csv file containing the beam ID, beam centre coordinates, and assigned channel ID. This file is then passed to the NTN simulation engine. An option is available for the user to directly modify this csv file through the GUI.
Band Frequency Information
| NR operating band | Uplink (UL) operating band BS receive / UE transmit \(F_{UL\_low}\) – \(F_{UL\_high}\) | Downlink (DL) operating band BS transmit / UE receive \(F_{DL\_low}\) – \(F_{DL\_high}\) | Duplex Mode |
|---|---|---|---|
| n256 | 1980 MHz – 2010 MHz | 2170 MHz – 2200 MHz | FDD |
| n255 | 1626.5 MHz – 1660.5 MHz | 1525 MHz – 1559 MHz | FDD |
| n254 | 1610 MHz – 1626.5 MHz | 2483.5 MHz – 2500 MHz | FDD |
| n512 | 27500 MHz – 30000 MHz | 17300 MHz – 20200 MHz | FDD |
| n511 | 28350 MHz – 30000 MHz | 17300 MHz – 20200 MHz | FDD |
| n510 | 27500 MHz – 28350 MHz | 17300 MHz – 20200 MHz | FDD |
Maximum transmission bandwidth configuration
The maximum transmission bandwidth configuration \(N_{RB}\) for each UE channel bandwidth and subcarrier spacing is specified below.
| SCS (kHz) | 5 MHz | 10 MHz | 15 MHz | 20 MHz | 30 MHz |
|---|---|---|---|---|---|
| NRB | NRB | NRB | NRB | NRB | |
| 15 | 25 | 52 | 79 | 106 | 160 |
| 30 | 11 | 24 | 38 | 51 | 78 |
| SCS (kHz) | 50 MHz | 100 MHz | 200 MHz | 400 MHz |
|---|---|---|---|---|
| NRB | NRB | NRB | NRB | |
| 60 | 66 | 132 | 264 | N/A |
| 120 | 32 | 66 | 132 | 264 |
Minimum guard band and transmission bandwidth configuration
| SCS (kHz) | 5 MHz | 10 MHz | 15 MHz | 20 MHz | 30 MHz |
|---|---|---|---|---|---|
| 15 | 242.5 | 312.5 | 382.5 | 452.5 | 592.5 |
| 30 | 505 | 665 | 645 | 805 | 945 |
| 60 | N/A | 1010 | 990 | 1330 | 1290 |
| SCS (kHz) | 50 MHz | 100 MHz | 200 MHz | 400 MHz |
|---|---|---|---|---|
| 60 | 1210 | 2450 | 4930 | 945 |
| 120 | 1900 | 2420 | 4900 | 9860 |
Simulation GUI
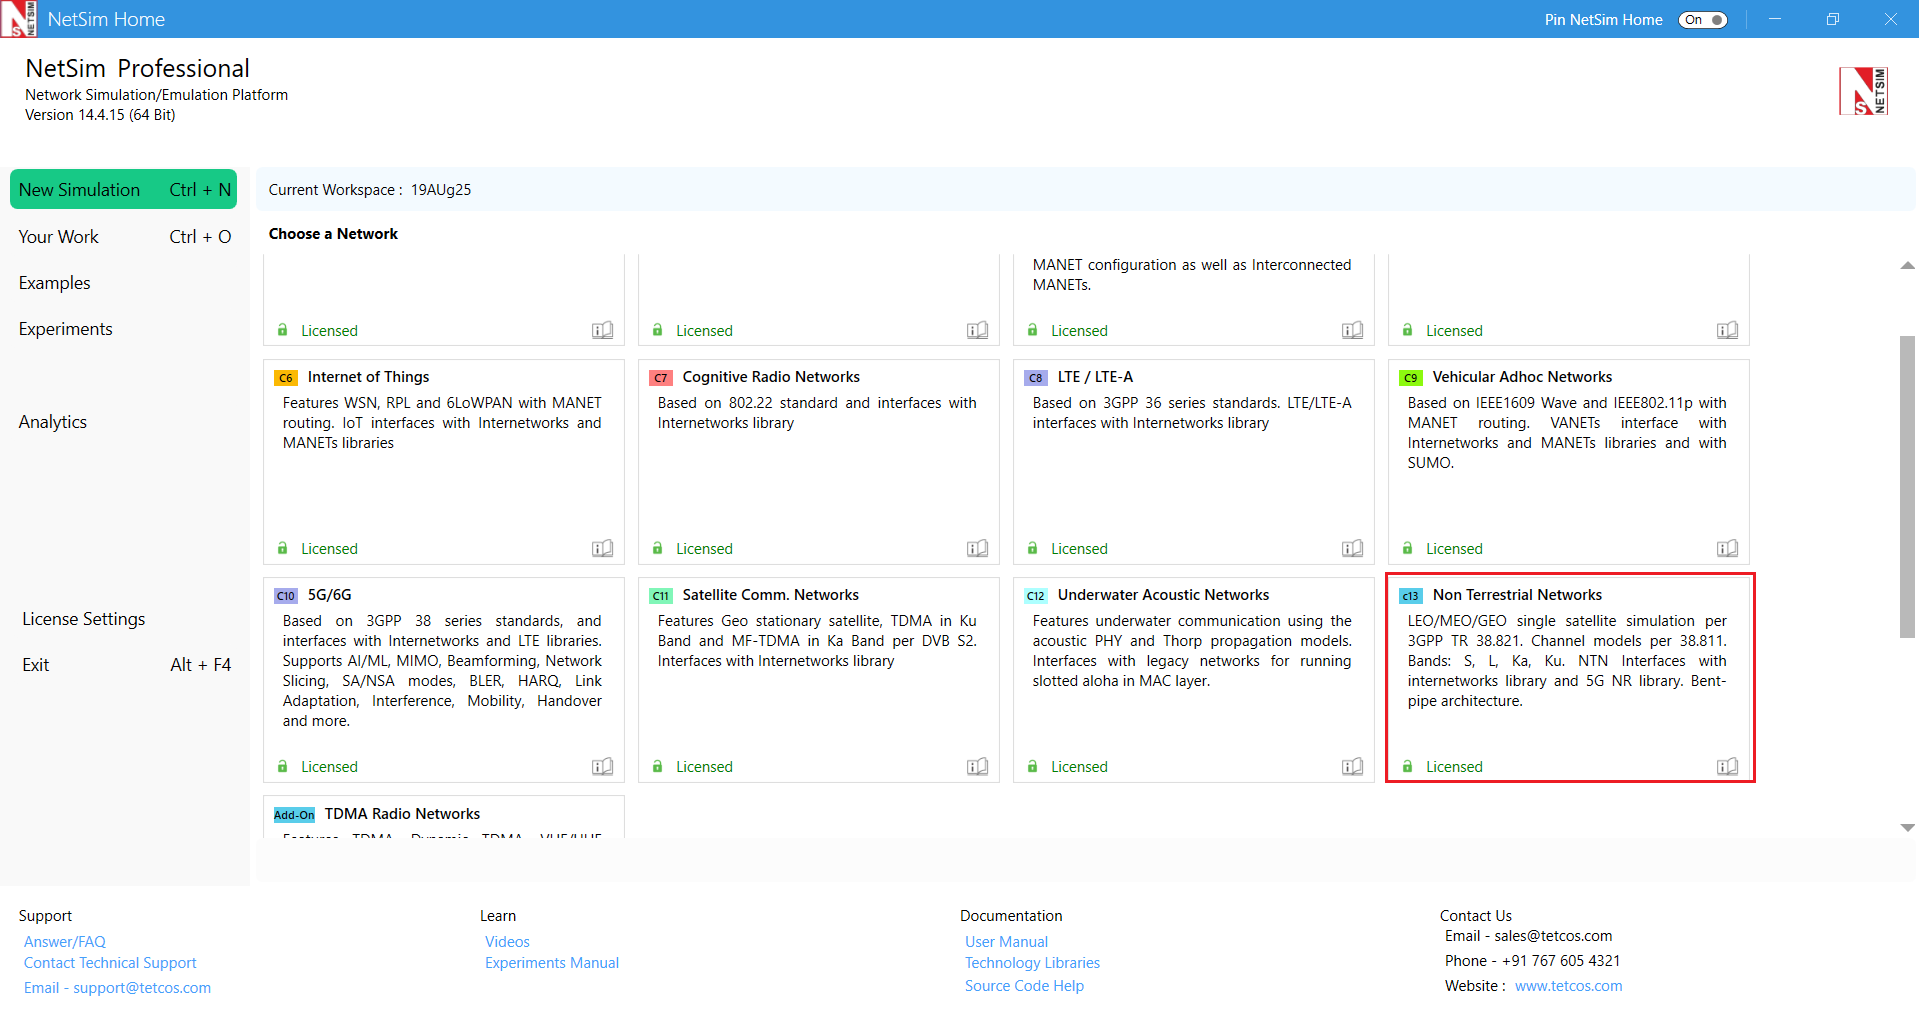
In the New simulation window select New Simulation \(\triangleright\) Non-Terrestrial Networks
Configure Non-Terrestrial Networks
Users can choose how the beam parameters can be configured.
Standard Setup: Allows you to create a scenario with predefined parameters based on 3GPP standards.
Custom Excel/CSV File: Allows you to define the beam configuration in your own Excel or CSV file.
Manual Placement: Allows you to manually place devices and beams. In this mode, no devices are automatically placed.

Set device properties

The following are main properties of Satellite device in PHY and MAC layer. To configure any properties in device, click on the device, expand the property panel on change the properties.

Configure an application by clicking on set traffic tab on top ribbon.

Application settings can be modified from Application properties tab on right panel.

Configure reports
Check Packet Trace / Event Trace option from the Configure Reports tab. To get detailed help, please refer to sections 8.4 and 8.5 in User Manual.

Enable protocol-specific logs such as NTN Radio Measurement Logs, NTN UE Beam Association Logs, NTN Resource Allocation Logs, and others. Additionally, view NTN Radio Measurement plots such as MCS Index vs Time, Shadow Fading Loss vs Time, SNR vs Time, Total Loss vs Time, and more.

GUI Parameters
| Parameter | Type | Range | Description |
|---|---|---|---|
| Frame Duration (ms) | Fixed | 10ms | The length of the frame in milliseconds. The FRAME DURATION is a non-editable parameter whose value is fixed at 10 ms. |
| Sub Frame Duration (ms) | Fixed | 1ms | The length of the frame in milliseconds. The SUBFRAME DURATION is a non-editable parameter whose value is fixed at 1 ms. |
| Subcarrier Number Per PRB | Fixed | 12 | The number of Subcarriers per PRB is a non-editable parameter whose value is fixed at 12. |
| Duplex Mode | Local | FDD | Frequency Division Duplexing: There are different frequency bands for UL and for DL. Hence UL and DL transmissions can occur simultaneously. As per 3GPP document, NetSim supports FDD bands and various CA configurations and Operating bands, FR1 and FR2 are available. |
| CA Type | Local | SINGLE_BAND | The single band drop-down options are per TS 38.101-5. |
| CA Configuration | Local | Depends on CA Type | The drop shows the frequency band options for the user to choose from. |
| CA Count | Fixed | Depends on CA Type and CA Configurations | This is a non-editable parameter that shows the number of component carriers based on the CA configuration. CA count would be 1 for Single Band configuration. |
| NOTE: For detailed information to Frequency Range (FR1 & FR2), Please, refer PHY Layer | |||
| Slot Type | Local | Downlink, Uplink | Slot type can be Uplink, or Downlink. Uplink: In uplink slot type, there are only uplink slots, and the DL:UL ratio will be fixed by NetSim as 0:1. Downlink: In downlink slot type, there are only downlink slots and the DL:UL ratio will be fixed by NetSim as 1:0. |
| Frequency Range | Local | FR1 & FR2 | The frequency bands for NTN is separated into two frequency ranges. First, is Frequency Range 1 (FR1) which includes sub-6 GHz frequency bands. The other is Frequency Range 2 (FR2) which includes frequency bands in the mmWave range. FR1: 1525 MHz – 2500 MHz. FR2: 17300 MHz – 30000 MHz. NetSim supports both FR1 and FR2. This is a non-editable parameter shown by NetSim based on the CA configuration chosen by the user. |
| DL/UL Ratio | Local | a:b | Represents the ratio in which slots are assigned to downlink and uplink transmissions. The value is in the form of a:b::DL:UL. Note that the ratio 1:0 or 0:1 might lead to NIL data transmissions since the initial attachment procedures require both UL and DL control packet transmissions. |
| Operating Band | Fixed | n254 n255, n256, n510, n511, n512 | The operating band whose numbering is defined by 3GPP. This is a non-editable parameter (except for custom band) that is shown by NetSim based on the CA configuration chosen by the user. |
| F Low (MHz) | Fixed | 1525–28350 MHz | The lowest frequency of the Uplink/Downlink operating band. This is a non-editable parameter (except for custom band) shown by NetSim based on the CA configuration chosen by the user. |
| F High (MHz) | Fixed | 1559–30000 MHz | The highest frequency of the Uplink/Downlink operating band. This is a non-editable parameter shown by NetSim based on the CA configuration chosen by the user. |
| Numerology | Local | \(\mu = 0, 1, 2, 3\) | Sub carrier spacing is derived from
numerology per the expression \(\Delta f =
2^{\mu} \times 15\,kHz\). Thus, Numerology = 0 means subcarrier spacing 15 kHz. Numerology = 1 means subcarrier spacing 30 kHz. Numerology = 2 means subcarrier spacing 60 kHz. Numerology = 3 means subcarrier spacing 120 kHz. |
| Channel Bandwidth (MHz) | Local | 5–400 MHz | The bandwidth can vary from 5 MHz to 30 MHz for bands in FR1 frequency range and 50 MHz to 400 MHz for bands in FR2 frequency range. Unit is MHz. |
| PRB Count | Local | PRB stands for physical resource block. The PRB count is dependent on Channel Bandwidth and automatically determined by NetSim. It cannot be edited in the GUI. | |
| Guard Band (KHz) | Local | 0, Standard Table (242.5–9860 kHz) | Guard band is the unused part of the radio
spectrum between radio bands, for the purpose of preventing
interference. The minimum guard bands are calculated using the following
equation: \((BWChannel \times 1000\;(kHz) - N_{RB} \times SCS \times 12) / 2 - SCS/2\). Unit is kHz. |
| Subcarrier Spacing | Local | 15 – 120 kHz | In 5G NR, subcarrier spacing of 15, 30,
60, 120 kHz are supported. Subcarrier spacing = \(15\,kHz\) (\(\mu = 0\)) Subcarrier spacing = \(30\,kHz\) (\(\mu = 1\)) Subcarrier spacing = \(60\,kHz\) (\(\mu = 2\)) Subcarrier spacing = \(120\,kHz\) (\(\mu = 3\)) |
| Bandwidth PRB | Local | 180 – 1440 kHz | The PRB bandwidth is dependent on
numerology (\(\mu\)) as shown below.
\(Unit = kHz\). Bandwidth= 180 \(kHz\) (\(\mu = 0\)) Bandwidth= 360 \(kHz\) (\(\mu = 1\)) Bandwidth= 720 \(kHz\) (\(\mu = 2\)) Bandwidth= 1440 \(kHz\) (\(\mu = 3\)) |
| Slot per Frame | Local | 10, 20, 40, 80 | This represents the number of slots in a frame and is a non-editable parameter. NetSim determines the slots per frame, based on the selected numerology, in the following way: When \(\mu\)= 0, a subframe has only one slot, and frame has 10 slots. When \(\mu\)= 1, a subframe has 2 slots, and a radio frame has 20 slots. When \(\mu\)= 2, a subframe has 4 slots in it, meaning a radio frame contains 40 slots. When \(\mu\)= 3, a subframe has 8 slots in it, meaning a radio frame contains 80 slots. |
| Slot per Subframe | Local | 1, 2, 4, 8 | This represents the number of slots in a sub-frame and is a non-editable parameter. NetSim determines the slots per sub-frame, based on the selected numerology, in the following way: When \(\mu\)= 0, a subframe has only one slot. When \(\mu\)= 1, a subframe has 2 slots. When \(\mu\)= 2, a subframe has 4 slots. When \(\mu\)= 3, a subframe has 8 slots. |
| Slot Duration (\(\mu\)s) | Local | 1000, 500, 250, 125\(\mu\)s | Slot duration is a non-editable parameter that depends on numerology selected. \(\mu\)= 0, Slot Duration = 1000 \(\mu\)s. \(\mu\)= 1, Slot Duration = 500 \(\mu\)s. \(\mu\)= 2, Slot Duration = 250 \(\mu\)s. \(\mu\)= 3, Slot Duration = 125 \(\mu\)s. |
| Cyclic Prefix | Local | Normal | If the cyclic prefix is set to “normal” then the number of symbols per slot is 14, if it is set to “extended” then the number of symbols per slot is 12. All carriers have the “normal” option while only certain carriers have the “extended” option. |
| NOTE: Cyclic Prefix is Extended only for few CA types. | |||
| Overhead (%) per DL slot | Local | 0.01–0.99 | This represents the fraction of symbols in
a slot used for control signalling. The remaining fraction is used for
data transmission. In NetSim calculations are done over aggregated PRBs
per the formula given below: Data PRB available = Total PRB available \(-\) Ceil(Total PRB available\(\times\)Overhead Fraction) DL Fraction range 0.01 to 0.99. Default: 0.14 for FR1, 0.18 for FR2. |
| Overhead (%) per UL slot | Local | 0.01–0.99 | This represents the fraction of symbols in
a slot used for control signalling. The remaining fraction is used for
data transmission. In NetSim calculations are done over aggregated PRBs
per the formula given below: Data PRB available = Total PRB available \(-\) Ceil(Total PRB available \(\times\) Overhead Fraction) UL Fraction range 0.01 to 0.99. Default: 0.08 for FR1, 0.10 for FR2. In 4G Network the default value is 0.25 for both FR1 and FR2. |
| Symbol Duration (\(\mu\)s) | Local | 71.43, 35.71, 17.86, 8.93 | Symbol duration is a non-editable parameter that depends on the numerology selected. When \(\mu=0\), symbol duration = 71.43 \(\mu\)s. When \(\mu=1\), symbol duration = 35.71 \(\mu\)s. When \(\mu=2\), symbol duration = 17.86 \(\mu\)s. When \(\mu=3\), symbol duration = 8.93 \(\mu\)s. |
| Antenna | |||
| TX Antenna Count | Local | 1 | The number of transmit antennas. |
| RX Antenna Count | Local | 1 | The number of receive antennas. |
| PDSCH CONFIG | |||
| MCS Table | Local | QAM64, QAM256, QAM64LOWSE | MCS Table stands for modulation and coding scheme Table. The selection options are QAM64, QAM 256, and QAM64LOWSE. We recommend users set the same MCS table for PDSCH and PUSCH. The appropriate CQI table setting would be as follows: For QAM64 – Table1. For QAM256 – Table 2. For QAM64LOWSE – Table 3. |
| X Overhead | Local | XOH0, XOH6, XOH12, XOH18 | Accounts for overhead from CSI-RS, CORESET, etc. If the xOverhead in PDSCH-ServingCellconfig is not configured (a value from 0, 6, 12, or 18), \(N_{oh}^{PRB}\) is set to 0. |
| PUSCH CONFIG | |||
| MCS Table | Local | QAM64, QAM256, QAM64LOWSE | MCS Table stands for modulation and coding scheme Table. The selection options are QAM64, QAM 256, and QAM64LOWSE. We recommend users set the same MCS table for PDSCH and PUSCH. The appropriate CQI table setting would be as follows: For QAM64 – Table1. For QAM256 – Table 2. For QAM64LOWSE – Table 3. |
| Transform Precoding | Local | Enable/Disable | Transform Precoding is the first step to create DFT-s-OFDM waveform. Transform Precoding is to spread UL data in a special way to reduce PAPR (Peak-to-Average Power Ratio) of the waveform. In terms of mathematics, Transform Precoding is just a form of DFT(Digital Fourier Transform). |
| CSI REPORT CONFIG | |||
| CQI Table | Local | Table1, Table2, Table3 | The CQI indices and their interpretations are chosen from Table 1 or Table 3 for reporting CQI based on QPSK, 16QAM, and 64QAM. The CQI indices and their interpretations are chosen from Table 2 for reporting CQI based on QPSK, 16QAM, 64QAM and 256QAM. This is based on 3GPP Table 5.2.2.1-2, Table 1, Table 2 and Table 3. Users must set the MCS and CQI tables in the following combination: QAM64: CQI Table 1. QAM 256: CQI Table 2. QAM 64 LOWSE: CQI Table 3. |
| CHANNEL MODEL | |||
| Pathloss Model | Local | None | In the current NTN implementation, only None is available. This is because the satellite-to-gNB link is a perfect link. It is assumed that the signal reaches the gNB without experiencing any degradation due to pathloss. |
| ERROR MODEL AND MCS SELECTION | |||
| MCS Selection Model | Global | IDEAL_SHANNON_THEOREM_BASED_RATE, SHANNON_RATE_WITH_ATTENUATION_FACTOR |
NetSim determines the modulation and
coding scheme in 5G and LTE, based on received SINR, per the following
models: Ideal Shannon Theorem-Based Rate: Spectral Efficiency is computed as \(Spectral\;Efficiency = log(1 + SINR)\) Shannon Rate with Attenuation Factor (\(\alpha\)): Spectral Efficiency is computed as \(Spectral\;Efficiency = \alpha \times log(1 + SINR)\) Then the 3GPP standards Spectral Efficiency vs MCS Table is looked up to select the MCS. This could be the 64QAM table, 256 QAM table, or the 64QAMLOWSE table depending on what was chosen by the user. |
| Attenuation Factor | Global | 0.5–1 | Attenuation factor (\(\alpha\)) takes value between 0.5 and 1 with the default value of 0.75. |
| BLER Model | Global | ZERO_BLER, BLER_ENABLE | Block Error Rate Model (BLER) is used to
decide code block and transport block error in 5G and LTE. If set to
true then NetSim looks up the SINR-CBS-MCS vs. BLER tables to decide on
the code block errors rate for the chosen MCS. Here MCS will be chosen
as explained in the MCS selection section. If OLLA is enabled then MCS
bump up/down will be based on HARQ ACKs/NACKs. Note: In NTN scenarios, BLER is always set to ZERO_BLER by default and should remain so, since HARQ retransmissions are disabled. Enabling BLER without HARQ would cause errored blocks to be dropped with no recovery. |
| Outer loop link adaptation | Global | TRUE, FALSE | The Outer Loop Link Adaptation (OLLA) technique, if enabled, can improve the channel quality estimation by adjusting the value of SINR by an offset dependent on whether previous transmissions were decoded successfully or not, as captured by Hybrid Automatic Repeat Request (HARQ) feedback. |
| Target BLER | Global | 0–1 | The OLLA algorithm in NetSim is designed to converge the transport BLER to the set value of the target BLER. Range: 0 to 1. |
| UE Properties | |||
| Interface (Service link) – Physical Layer | |||
| TX Antenna Count | Local | 1 | The number of transmit antennas. |
| RX Antenna Count | Local | 1 | The number of receive antennas. |
| TX Power (dBm) | Local | 23 | UE total transmit power for the uplink EIRP computation. Default is 23 dBm (Power Class 3 handheld UE). \(EIRP_{UE} = P_{Tx,UE} + G_{UE,Tx}\). |
| Tx/Rx Antenna Gain (dB) | Local | 0 | UE Tx/Rx antenna gain in dBi. For omnidirectional handheld UEs this is 0 dBi. Used together with TX Power to compute the uplink EIRP. Additionally used as Rx Antenna Gain in the downlink G/T computation for the UE receiver. |
| UE Noise Figure (dB) | Local | 7 | UE receiver noise figure in dB. Used in the downlink G/T computation for the UE receiver. |
| NTN Logs | |||
| NTN UE Beam Association Log | Global | Enable or Disable | The NTN UE Beam Association log file records Time, UE Pos, Elevation Angle, Slant height, Theta, EIRP, PathLoss, ShadowLoss, Additional Loss, Clutter Loss, Angular Antenna Gain, Rx Power, Interference Power, SNR, SINR, CQI, MCS Index, Associated Beam flag, measurements are logged at association and at UE mobility. |
| NTN Radio Measurements Log | Global | Enable or Disable | The NTN Radio measurements csv log file records Timestamp, Slant height, Elevation Angle, EIRP, PathLoss, ShadowFadingLoss, AdditionalLoss, ClutterLoss, TotalLoss, BeamFormingGain, Angular Antenna Gain, UE Rx Antenna Gain, Rx Power, SNR, SINR, and more, for each carrier on the PDSCH, and are logged every sub-frame. |
| NTN Resource Allocation Log | Global | Enable or Disable | The NTN Radio Resource Allocation csv log file records information related to physical resource block (PRB) allocation such as the Total PRBs, Slot Start Time(ms), Slot End, BitsPerPRB, BufferFill, Allocated PRBs, Rank (scheduling metric) and more, in the DL and in the UL. All these parameters are written in every slot. |
| NTN Code Block Log | Global | Enable or Disable | Records parameters associated with Code Block segmentation such as Process ID, TB size, Modulation, Code Rate, CBS, BLER, CBG ID, etc. along with remarks on events associated with HARQ and PRB allocation. This will be useful to understand BLER model and Code Block segmentation in 5G. |
| Satellite Properties \(\triangleright\) Service link | |||
| CHANNEL MODEL | |||
| EIRP Density (dBW/MHz) | Local | Editable based on band and satellite height | Editable based on the frequency band and satellite altitude. This parameter defines the effective isotropic radiated power per unit bandwidth. |
| Antenna Aperture Radius (m) | Local | Editable based on frequency band and satellite altitude | Editable based on the band and the scenario. For the standard scenarios, a pre-calculated value is provided. The aperture radius determines the beamwidth and, in turn, the beam radius on the Earth’s surface. |
| Noise Figure (dB) | Local | 0.1 to 12 dB | Represents the satellite receiver’s internal noise contribution. A lower noise figure indicates a more sensitive receiver capable of detecting weaker signals. Used in the uplink satellite G/T computation. |
| Max Antenna Gain (dB) | Local | 30 | Peak antenna gain of the satellite in dBi. Used in the uplink satellite G/T computation: \(G/T|_{sat} = G_{sat,abs}(\theta) - 10\log_{10}(T_{sys}) - NF_{sat}\), where \(G_{sat,abs}(\theta) = G_{max} + G_{rel}(\theta)\). |
| Satellite Rx Antenna Temperature (K) | Local | 290 | System noise temperature of the satellite receiver in Kelvin. Used in the uplink satellite G/T computation. LEO satellites may have 150–600 K depending on antenna pointing direction. |
| Frequency Reuse Factor | Local | FR1, FR3 | Represents the number of channels allocated per beam configuration. FR1 indicates full frequency reuse across all beams, while FR3 reduces inter-beam interference by using three distinct frequency groups. |
| Beam Radius (km) | Local | Editable based on band and scenario | The beam radius is calculated based on the frequency band, satellite altitude, and aperture radius for the selected scenario, and is defined at the point where the beam power drops to half of its maximum value (i.e., 3 dB beamwidth). |
| Beam Count | Local | 1, 7, 19 | Refers to the number of beams formed in the coverage area. A single central beam corresponds to 1. The 7-beam configuration includes one central beam surrounded by a single hexagonal ring, while the 19-beam configuration includes the central beam with two hexagonal layers of surrounding beams. |
| Pathloss Model | Local | Free Space | NetSim computes signal attenuation per the mean pathloss model. The option available is Free space. |
| Outdoor Scenario | Local | Rural, Urban, Dense Urban | There are three types of outdoor scenarios possible namely: Rural, Urban, and Dense Urban, as defined in the 3GPPTR38.811 standard section 6.1.2. The propagation characteristics of these scenarios are provided in the NTN Technology library manual. |
| LOS/NLOS Selection | Fixed | 3GPPTR38.811, USER DEFINED | 3GPPTR38.811-Table 6.6.1-1: The LOS mode, either Line-of-sight or Non-Line-of-sight is based on LOS probability calculated per the TR 38.811 Standard Table 6.6.1-1. User Defined: LOS probability is not per standard but is based on user input. NetSim will determine whether a device is in line-of-sight or non-line-of-sight based on the LOS probability value set by the user. |
| LOS Probability | Local | 0 to 1 | LOS Probability defines the LOS mode. If LOS Probability=1, the LOS mode is set to Line-of-Sight explicitly and if the LOS Probability=0, the LOS mode is set to Non-Line-of-Sight explicitly. For any value between 0–1, LOS mode is set per the given probability, by tossing a biased coin. |
| Fading and Beamforming | Local | NO FADING MIMO UNIT GAIN, RAYLEIGH WITH EIGEN BEAMFORMING | RAYLEIGH WITH EIGEN BEAMFORMING: When fading and beamforming is enabled, NetSim uses the rich scattering in the channel to form spatial channels. The number of spatial channels is equal to the number of layers (in turn equal to \(Min\;(N_t, N_r)\)). The beamforming gains in the spatial channel is equal to the eigen values of the channel covariance (Wishart) matrix. When running in SISO (\(N_t = N_r = 1\)) this simply simulates Rayleigh fading. NO FADING MIMO UNIT GAIN: No fading with gain equal to unity (0 dB). |
| Additional Loss Model | Local | 0 to 10 dB | Additional loss can be set from 0 to 10 dB to account for atmospheric and scintillation losses as per the configured scenario. |
| Shadowing Model | Local | None, Log Normal | Constant: A shadowing model is used to represent the signal attenuation caused by obstructions along the propagation path. The constant shadowing model is suitable for the scenarios without mobility where the obstructions along the propagation paths remain unchanged. Log Normal: The lognormal shadowing model is suitable for a scenario with mobility and obstructions within the propagation environment. In this model, the shadowing value follows a log-normal distribution with a user specified standard deviation. |
| Standard Deviation Selection (dB) | Local | User Defined (5 to 12 dB), 3GPPTR38.811 | Shadowing is caused mainly by terrain features of the radio propagation environment. The mathematical model for shadowing is a log-normal distribution. The standard deviation can be selected from the 3GPPTR38.811 Table 6.6.2, based on the elevation angle and the chosen outdoor scenario. User Defined: users can specify the standard deviation values in the range of 5 to 12 dB. |
| INTERFERENCE MODEL | |||
| Downlink Interference Model | Global | None, CIR Based, Exact geometric model | DL interference options are No interference, CIR Based, and Exact geometric model. If no interference is chosen then in the SINR calculations, the value of I is set to \(-\)1000. CIR Based, the User enters Carrier-to-Interference ratio, that value is used to calculate the interference. (CIR Ratio: \(-\)20 to 20 dB). Geometric models compute the exact interference. |
| Uplink Interference Model | Global | None, CIR Based | UL interference options. If None, interference is not considered in the uplink SINR calculation. If CIR Based, the user-specified UL C/I ratio is used to compute uplink interference. |
| UL C/I Ratio (dB) | Global | \(-\)20 to 20 | Carrier-to-Interference ratio for the uplink, used when the UL interference model is set to CIR Based. Default: 20 dB. |
| UL SCHEDULING | |||
| UL Scheduling Type | Fixed | Configured Grant | Read-only. In NTN scenarios, the uplink uses Configured Grant Type 1 scheduling. The gNB pre-allocates periodic UL resources to each UE via cyclic round-robin, eliminating per-transmission grant signaling. |
Mobility model in NTN
Satellite and UE devices support file-based mobility in NTN.
In the File Based Mobility model, users can write their own custom mobility models and define the movement of the mobile users. The content should be per the NetSim Mobility File Format explained below. Users can also generate the mobility files using external tools like SUMO (Simulation of Urban Mobility), etc.
The NetSim Mobility File setting and format is explained below:
Step 1: Right click to open Properties as a new window of Satellite or UE. Then properties \(\triangleright\) Position Properties \(\triangleright\) Mobility model as File Based Mobility and click on Open Mobility file.
Step 2: Inside the csv file and write the node mobility in format shown below.
<TIME IN SECONDS>,<DEVICE ID>Lat(deg),Lon(deg),Alt(m)