Wi-Fi 802.11 WLAN
802.11 a/b/g/n/ac/ax/p · CSMA/CA · MIMO · OFDM / HE
Design, model, and simulate Wi-Fi networks with Access Points and Wireless Nodes. Build the network in a drag-and-drop GUI. A unified dashboard shows the throughput, delay, jitter, error and TCP results.
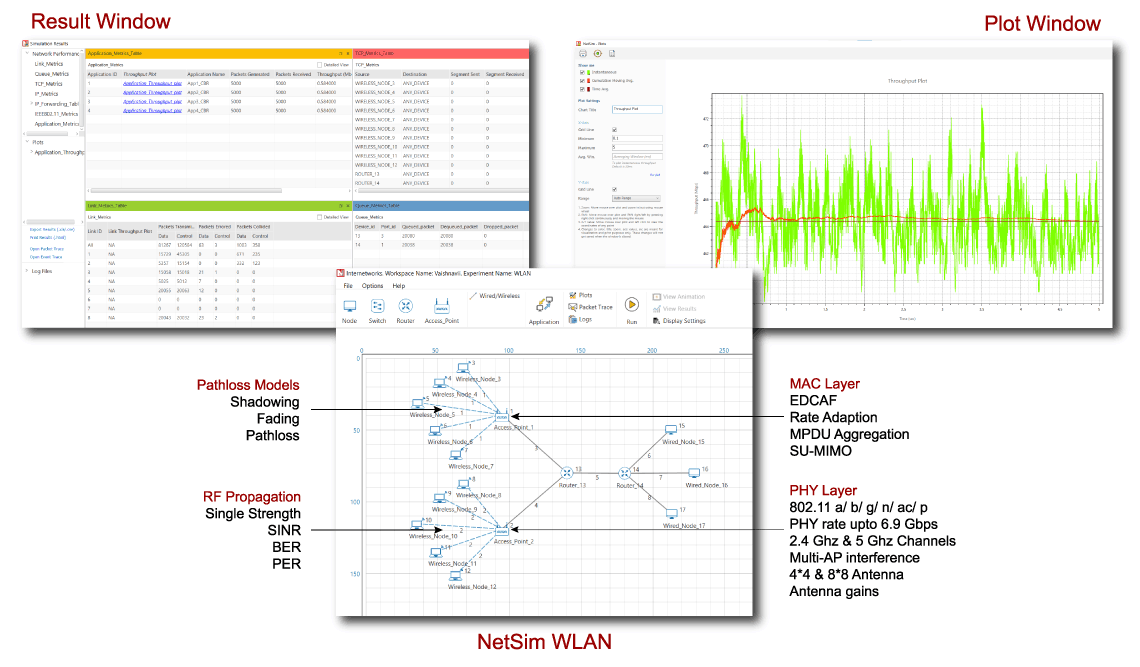
What you can do with it
Build an 802.11 network, model the full MAC and PHY, and analyse the results in one place.
Design Wi-Fi networks
Drag and drop Access Points and Wireless Nodes (STA), then set their properties with a right click.
Model the full stack
MAC (CSMA/CA, aggregation, EDCA QoS) and PHY (a/b/g/n/ac/ax/p) with rate adaptation.
Unified results dashboard
Application and link throughputs, buffer occupancy, TCP congestion windows, delay, jitter and errors.
Wireshark & CLI
Export traffic to Wireshark and run batch simulations from the CLI with XML configuration files.
MAC layer
CSMA/CA channel access with rate adaptation, aggregation and quality of service.
Rate adaptation & MCS
- Rate adaptation: Minstrel, Generic
- MCS selection: Auto rate fallback, Fixed
CSMA/CA
- RTS / CTS exchange
- DIFS, backoff and collisions
- SIFS and ACK
Infrastructure
- BSS mode
- DCF mode
Aggregation & QoS
- MPDU aggregation in 802.11n and 802.11ac
- IEEE 802.11e quality of service based on EDCA
PHY layer
The table gives the supported 802.11 amendments, with their frequency, bandwidth, modulation and peak data rate.
| Standard | Frequency | Bandwidth | Modulation | Max data rate |
|---|---|---|---|---|
| 802.11a | 5 GHz | 20 MHz | OFDM | Up to 54 Mbps |
| 802.11b | 2.4 GHz | 20 MHz | DSSS | Up to 11 Mbps |
| 802.11g | 2.4 GHz | 20 MHz | OFDM | Up to 54 Mbps |
| 802.11n (MIMO 4×4) | 2.4 and 5 GHz | 20 and 40 MHz | HT | Up to 600 Mbps |
| 802.11ac (MIMO 8×8) | 5 GHz | 20, 40, 80 and 160 MHz | VHT | Up to 6.933 Gbps |
| 802.11p | 5.9 GHz | 5, 10, 20 MHz | OFDM | Up to 54 Mbps |
| 802.11ax | 2.4 and 5 GHz | 20, 40, 80, 160 MHz | HE | Up to 9.6 Gbps |
SNR / BER / PER calculation procedure
NetSim turns transmit power and channel conditions into error behaviour. It does this calculation for each packet, over a time-varying channel.
Received Signal Strength (RSS)
RSS = Transmit Power − RF Propagation Losses
- RF propagation losses include path loss, fading and shadowing
Interference
Consider all co-channel transmissions occurring simultaneously:
- Use propagation models to compute the power of each interfering signal
- Include interfering transmitters at different locations
SINR
SINR = RSS / (Interference + Noise)
Bit Error Rate (BER)
Look up SINR-BER curves for the given Modulation and Coding Scheme (MCS).
Packet Error Probability (PEP)
Derive PEP from the calculated BER.
Rate-error abstraction for PHY transmission
Using the calculated rate and PEP, NetSim abstracts packet transmission and reception over the air:
- NetSim does these calculations for each packet, because channel conditions can change with time
- NetSim logs all radio parameters for each packet transmission to a CSV file, for detailed analysis
Propagation models
Path loss, fading and shadowing models for the wireless channel.
Path loss models
- File based
- Range based
- Log distance
- Friis free space
- HATA Urban / Suburban
- Indoor Office
- Indoor Home
- COST 231 HATA Urban / Suburban
Fading models
- Rayleigh
- Nakagami
- Rician
Shadowing models
- Lognormal
- Constant
Traffic, applications, and control
Generate application traffic, extend it with custom models and C source, and drive runs from the command line.
Application traffic generator
- FTP, Database, Voice, Video, Email, HTTP
- Peer to Peer, CBR, Gaming
- Custom model: define an application by packet size and inter-arrival time from the available probability distributions
Source code & command line
- Protocol source C code included
- CLI mode for scripted control
- Automated scripts for batch simulations
- Network configurations via XML configuration files
Results and analysis
NetSim gives a unified dashboard, per-packet radio logs and Wireshark packet capture.
Network to application
Network, link, application and protocol-specific metrics, plus forwarding tables.
Packets & protocols
Throughputs, delays, data and control packet information and protocol-specific results.
Time-series plots
Link and application throughput and TCP congestion window over time.

Per-packet radio measurements log.
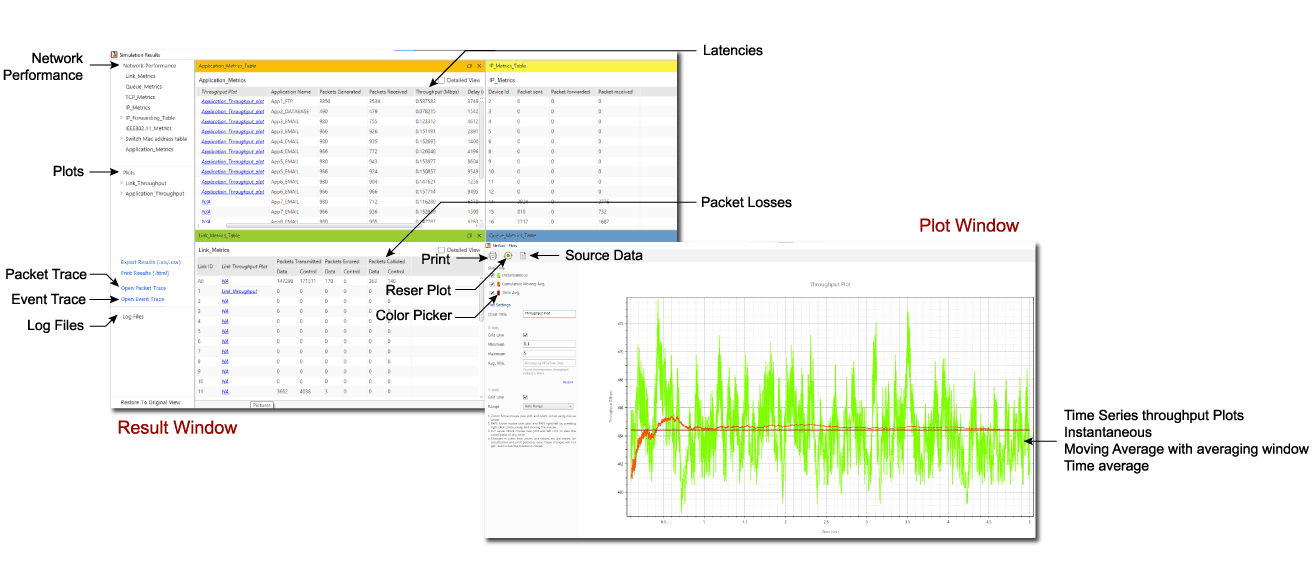
The unified results dashboard.
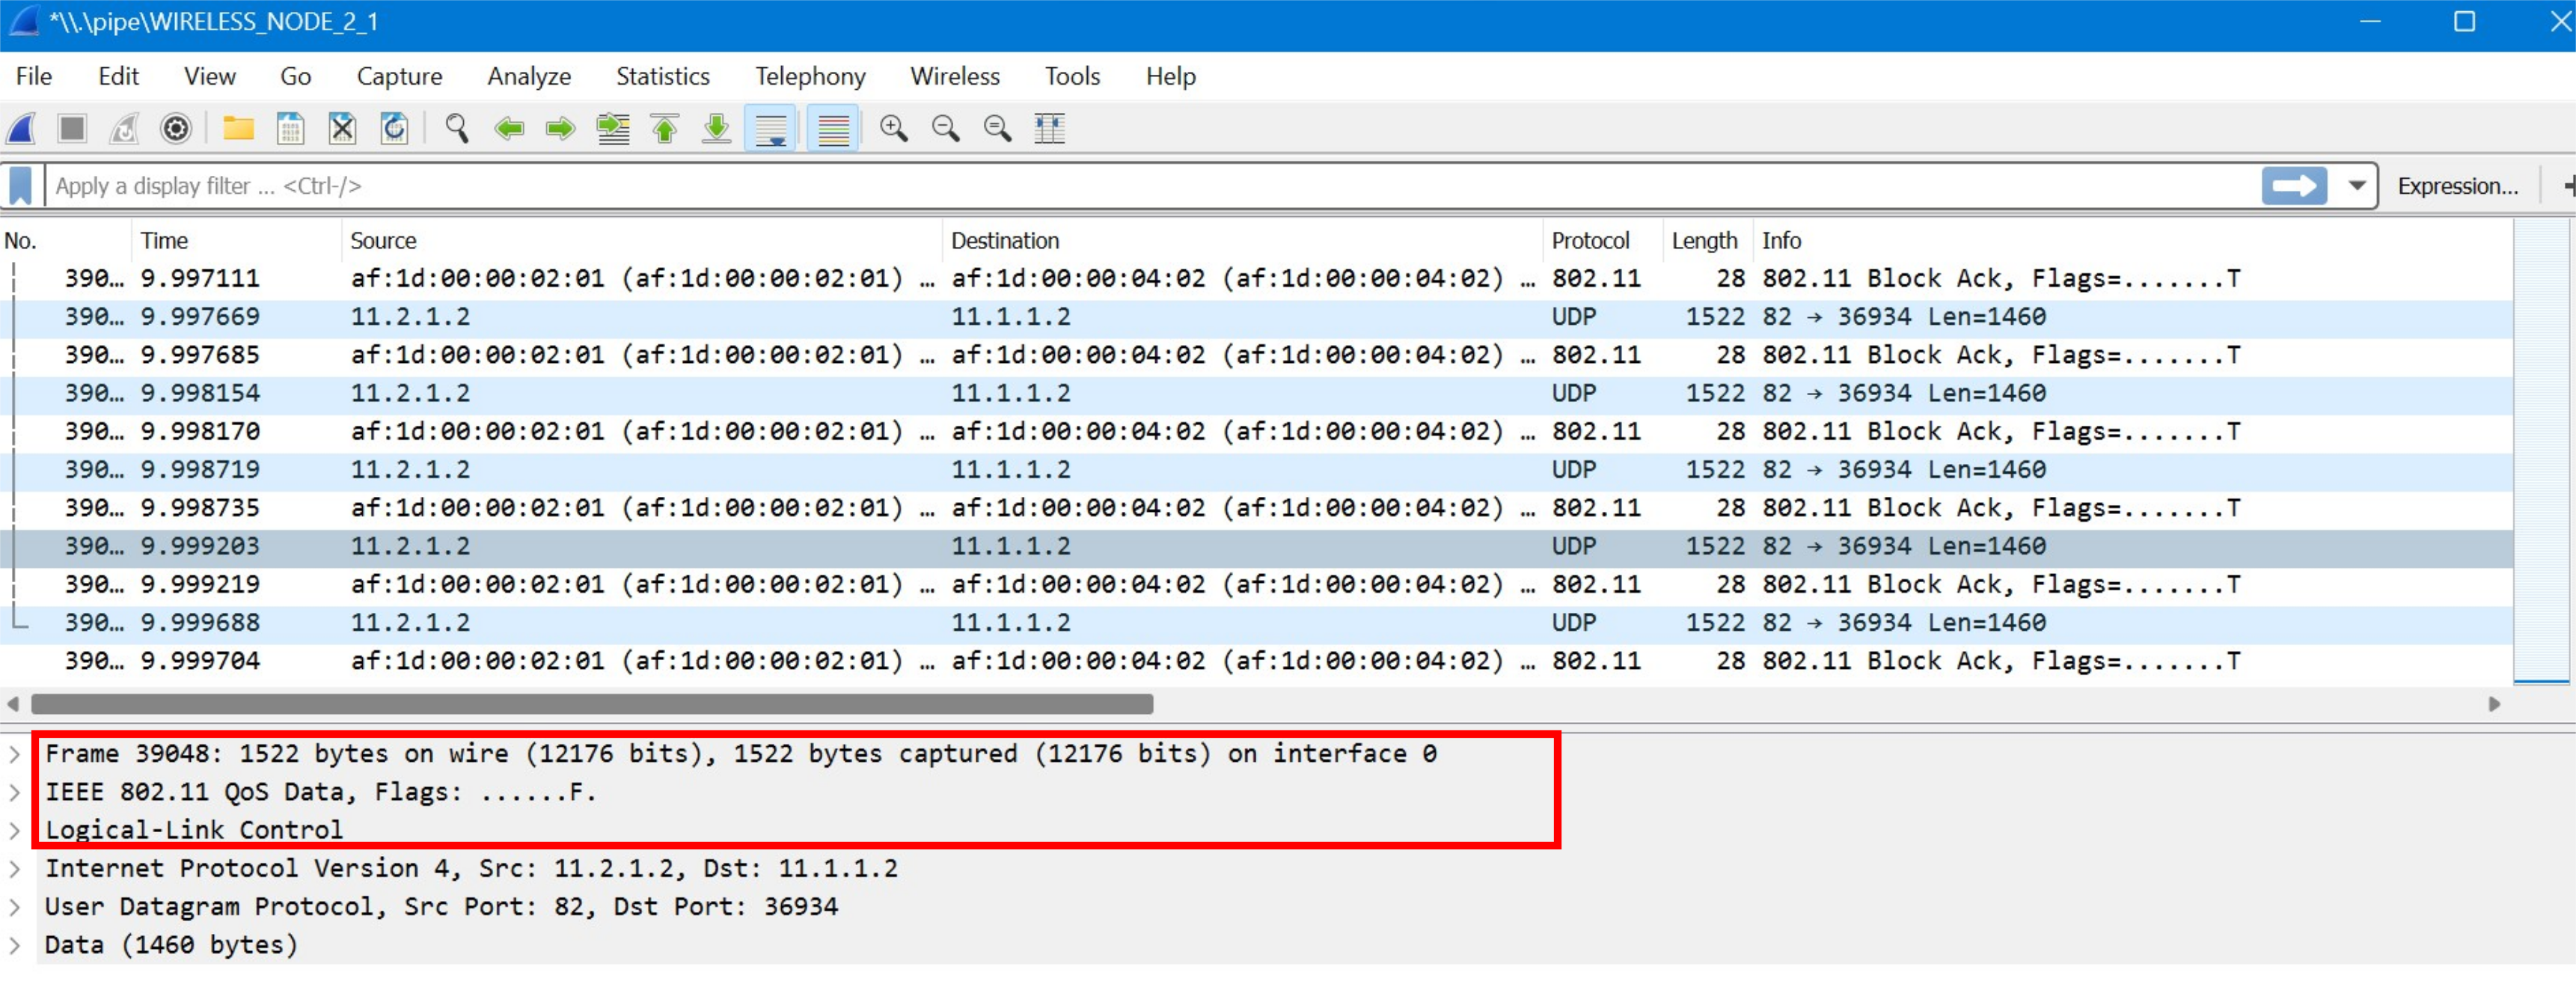
WLAN traffic in a Wireshark packet capture.
Unsupported features and limitations
The current WLAN library does not model these features.
- Association, probing, beaconing
- MSDU aggregation
- Directional antennas
- Beamforming
- PLCP preamble reception
Useful links
Use the documentation, examples and support to take a Wi-Fi project further.